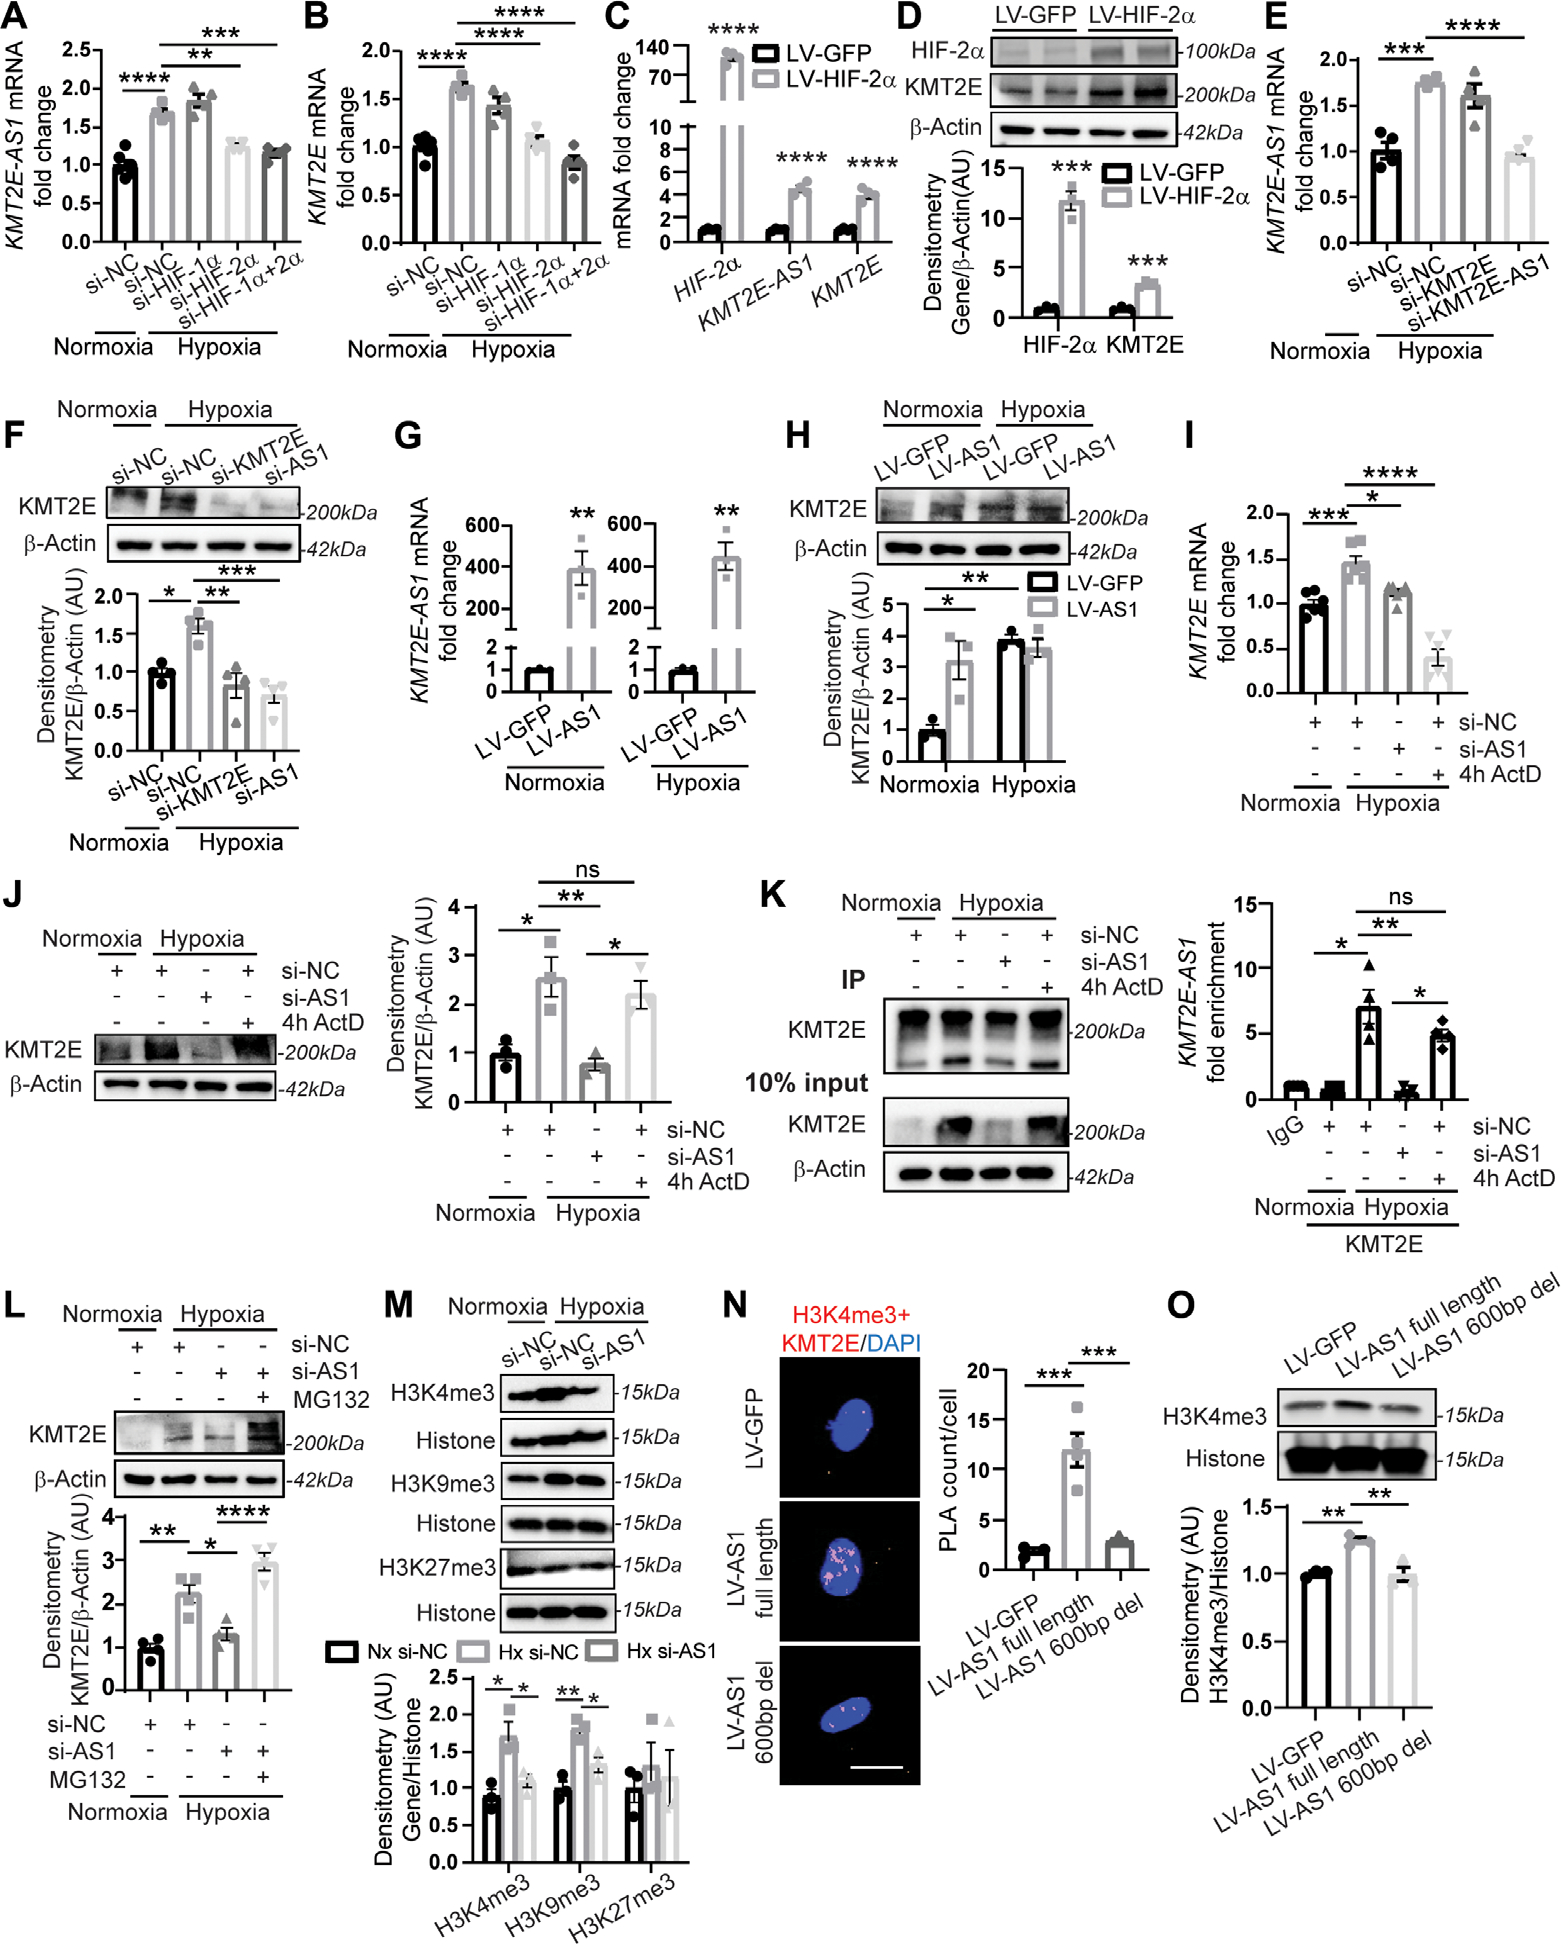
Fig. 2. KMT2E-AS1 interacts with KMT2E to enhance protein stability and increase histone 3 lysine 4 trimethylation (H3K-4me3).

(A and B) KMT2E-AS1 (a) and KMT2E (B) transcripts in hypoxic human PAECs with knockdown (siRNA) of HIF-2α and/or HIF-1α versus normoxic scramble control (NC) (n = 4 to 6; **P < 0.01, ***P < 0.001, ****P < 0.0001, one-way ANOVA followed by Bonferroni’s post hoc analysis; data represent mean ± SEM). (C) KMT2E-AS1, KMT2E, and HIF-2α transcripts in normoxic human PAECs with overexpression of a constitutively active HIF-2α (lV-HIF-2α versus LV-GFP control) (n = 4; ****P < 0.0001, unpaired Student’s t test; data represent mean ± SEM). (D) HIF-2α and KMT2e proteins in normoxic human PAECs transduced with lV-HIF-2α versus LV-GFP control (n = 3; ***P < 0.001, unpaired Student’s t test; data represent mean ± SEM). (E) KMT2E-AS1 transcript in human PAECs under hypoxia and siRNA knockdown of KMT2E or KMT2E-AS1 (n = 4; ***P < 0.001, one-way ANOVA followed by Bonferroni’s post hoc analysis; data represent mean ± SEM). (F) KMT2e protein in human PAECs under hypoxia and knockdown of KMT2E or KMT2E-AS1 (n = 4; *P < 0.05, **P < 0.01, one-way ANOVA followed by Bonferroni’s post hoc analysis; data represent mean ± SEM). (G) KMT2E-AS1 transcript in human PAECs posttransduction with KMT2E-AS1 lentivirus (LV-AS1) versus GFP control (LV-GFP) under normoxia (left) and hypoxia (right) (n = 3; **P < 0.01, unpaired Student’s t test; data represent mean ± SEM). (H) KMT2e protein in human PAECs transduced as in (G) by (n = 3; *P < 0.05, **P < 0.01, two-way ANOVA followed by Bonferroni’s post hoc analysis; data represent mean ± SEM). (I) KMT2E transcript in human PAECs under hypoxia and KMT2E-AS1 knockdown or 4 hour (4h) exposure to the transcriptional inhibitor actinomycin D (ActD) (n = 6; *P < 0.05, **P < 0.01, ****P < 0.0001, one-way ANOVA followed by Bonferroni’s post hoc analysis; data represent mean ± SEM). (J) KMT2e protein in human PAECs after KMT2E-AS1 knockdown or actinomycin d (ActD) exposure under hypoxia (n = 3; *P < 0.05, **P < 0.01, one-way ANOVA followed by Bonferroni’s post hoc analysis; data represent mean ± SEM). ns, not significant. (K) RNA immunoprecipitation (RIP)–qPCR [IP: KMT2e versus immunoglobulin G (IgG) negative control] of KMT2e protein in normoxia and hypoxia (left immunoblot). KMT2E-AS1 transcript in the IP fraction of human PAECs after KMT2E-AS1 knockdown or ActD exposure (4 hours) under hypoxia (right graph) (n = 4; *P < 0.05, **P < 0.01, Kruskal Wallis test followed by dunn’s post hoc analysis; data represent mean ± SEM). (L) KMT2e protein in human PAECs after KMT2E-AS1 knockdown or proteasomal inhibitor MG132 in hypoxia (n = 4; *P < 0.05, **P < 0.01, ****P < 0.0001, one-way ANOVA followed by Bonferroni’s post hoc analysis; data represent mean ± SEM). (M) h3K4me3, h3K9me3, and h3K27me3 in human PAECs after hypoxia and KMT2E-AS1 knockdown (n = 3; *P < 0.05, **P < 0.01, one-way ANOVA followed by Bonferroni’s post hoc analysis for H3K4me3 and H3K9me3, Kruskal-Wallis test followed by dunn’s post hoc analysis for H3K27me3; data represent mean ± SEM). (N) nuclear interaction of H3K4me3 marks and KMT2e protein, measured by proximity ligation assay (PLA; red, left images) and quantified by PLA counts per cell (right graph) in human PAECs after lentiviral expression of KMT2E-AS1 (full length) or KMT2E-AS1 deletion mutant (fig. S8) versus GFP control (n = 3 or 4; ***P < 0.001, one-way ANOVA followed by Bonferroni’s post hoc analysis; data represent mean ± SEM). Scale bar, 20 μm. (O) H3K4me3 in human PAECs under lentiviral expression of KMT2E-AS1 (full length) or KMT2E-AS1 deletion mutant (n = 3; **P < 0.01, one-way ANOVA followed by Bonferroni’s post hoc analysis; data represent mean ± SEM).
