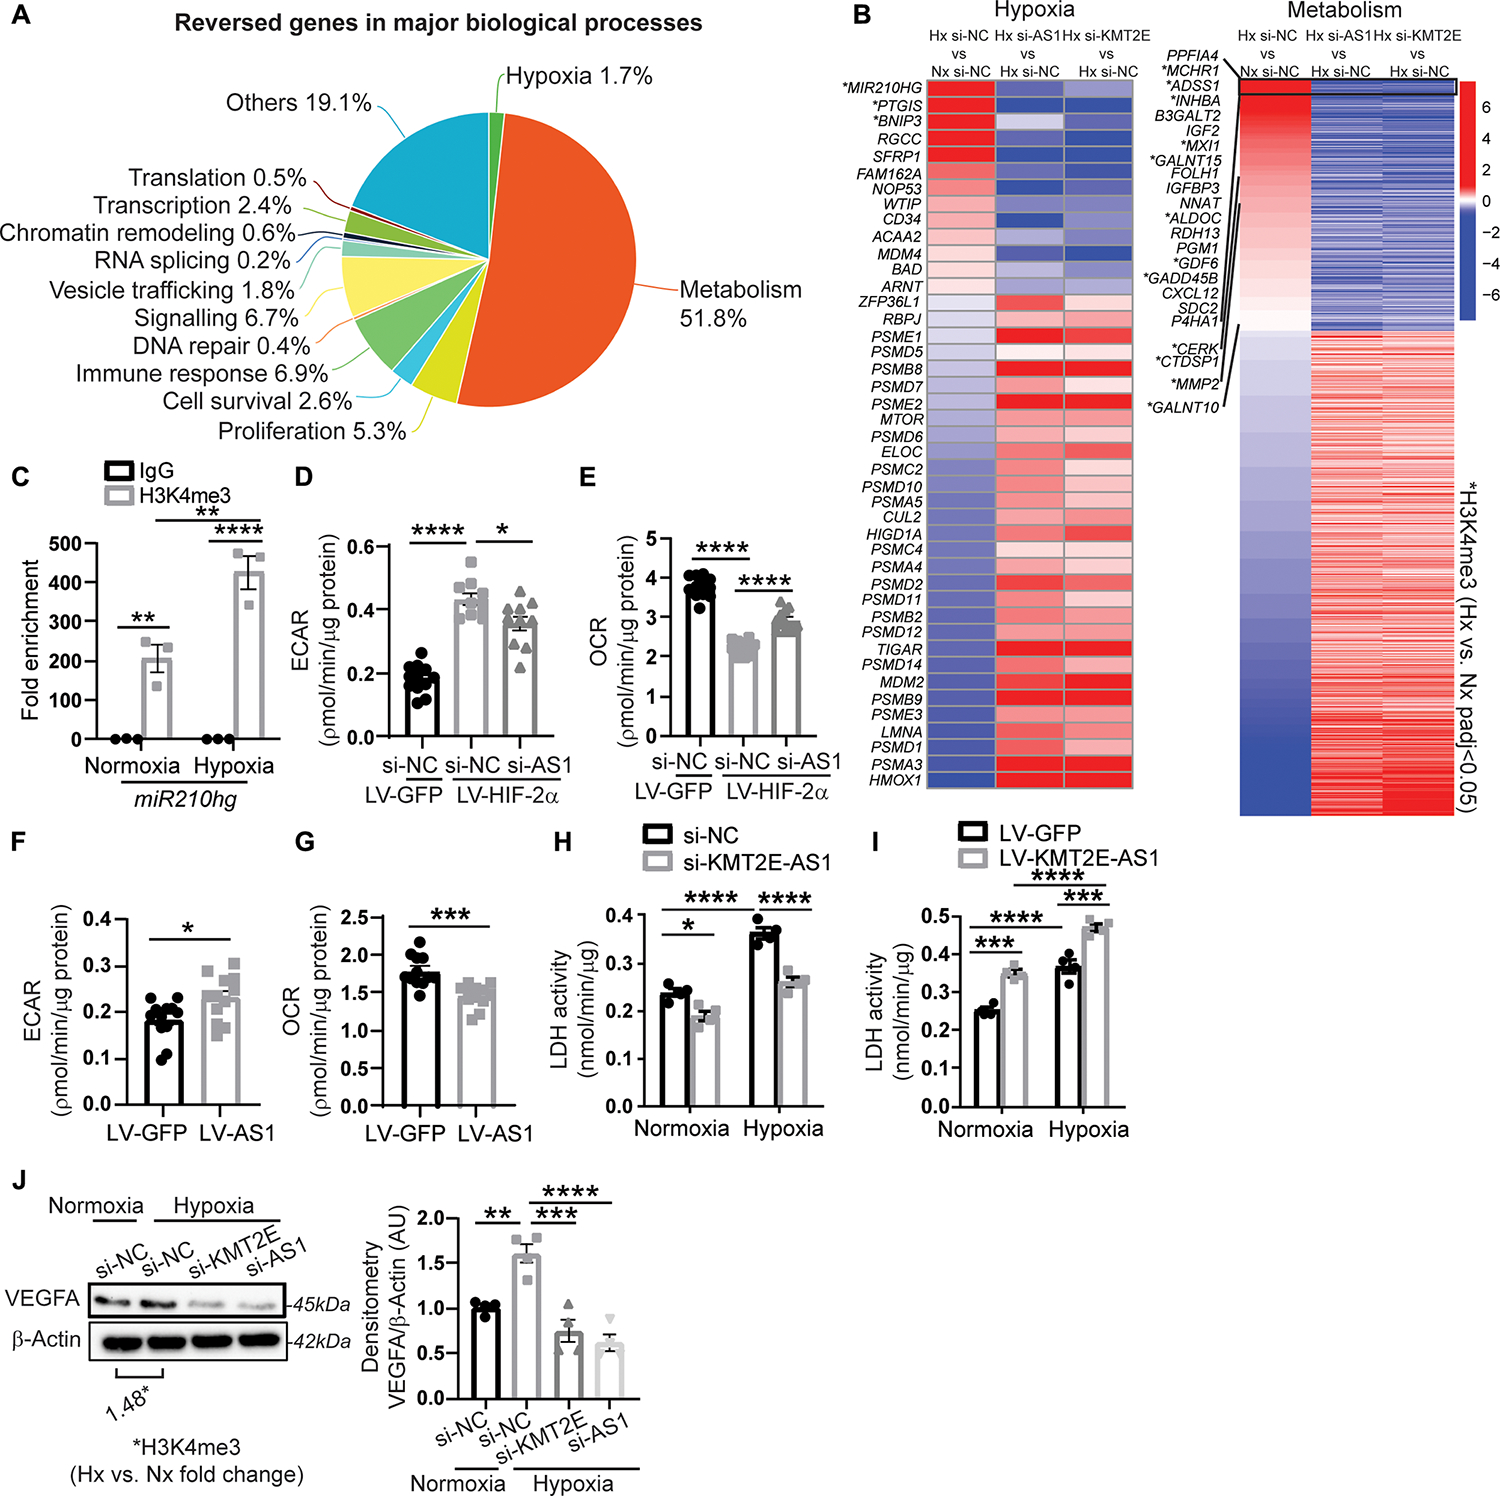
Fig. 3. KMT2E-AS1 regulates a gene network driving hypoxic metabolic reprogramming.

(A) RNA sequencing of human PAECs revealed that 2480 genes are altered by hypoxia and reversed by either KMT2E-AS1 or KMT2E in hypoxia. GSEA reveals the major biological processes represented by these reversed genes. (B) heatmaps display genes in hypoxia and metabolism networks that are altered by hypoxia (leftmost column) and are reversed by KMT2E-AS1 (middle column) and KMT2E (rightmost column) knockdown in hypoxia. Adjusted P < 0.05 for each gene shown. H3K4me3 ChIP-Seq was also performed in hypoxic versus normoxic PAECs. A subcohort of these genes displays increased h3K4me3 marks in hypoxia by co-analyzing these ChIP-Seq and RNA sequencing data (* indicates methylated genes with adjusted P < 0.05). (C) ChIP qPCR of h3K4me3 binding at the promoter site of the lncRNA miR210hg (n = 3; **P < 0.01, ****P < 0.0001, two-way ANOVA followed by Bonferroni’s post hoc analysis; data represent mean ± SEM). (D and E) extracellular acidification rate (ECAR) (d) and baseline OCR (E) of human PAECs after KMT2E-AS1 knockdown and HIF-2α overexpression (n = 10 to 12; *P < 0.05, ****P < 0.0001, one-way ANOVA followed by Bonferroni’s post hoc analysis; data represent mean ± SEM). (F and G) ECAR (F) and baseline OCR (G) after KMT2E-AS1 overexpression (n = 12; *P < 0.05, ***P < 0.001, unpaired Student’s t test; data represent mean ± SEM). (H and I) LDH enzymatic activity of human PAECs after KMT2E-AS1 knockdown (H) and KMT2E-AS1 overexpression (I), a representative measure of glycolysis (n = 4; *P < 0.05, ***P < 0.001, ****P < 0.0001, two-way ANOVA followed by Bonferroni’s post hoc analysis; data represent mean ± SEM). (J) VEGF abundance in hypoxic PAECs after knockdown of KMT2E and KMT2E-AS1 (n = 4; **P < 0.01, ***P < 0.001, ****P < 0.0001, one-way ANOVA followed by Bonferroni’s post hoc analysis; data represent mean ± SEM), overlayed with ChIP-seq of h3K4me3 at the VEGFA gene in hypoxia versus normoxia.
