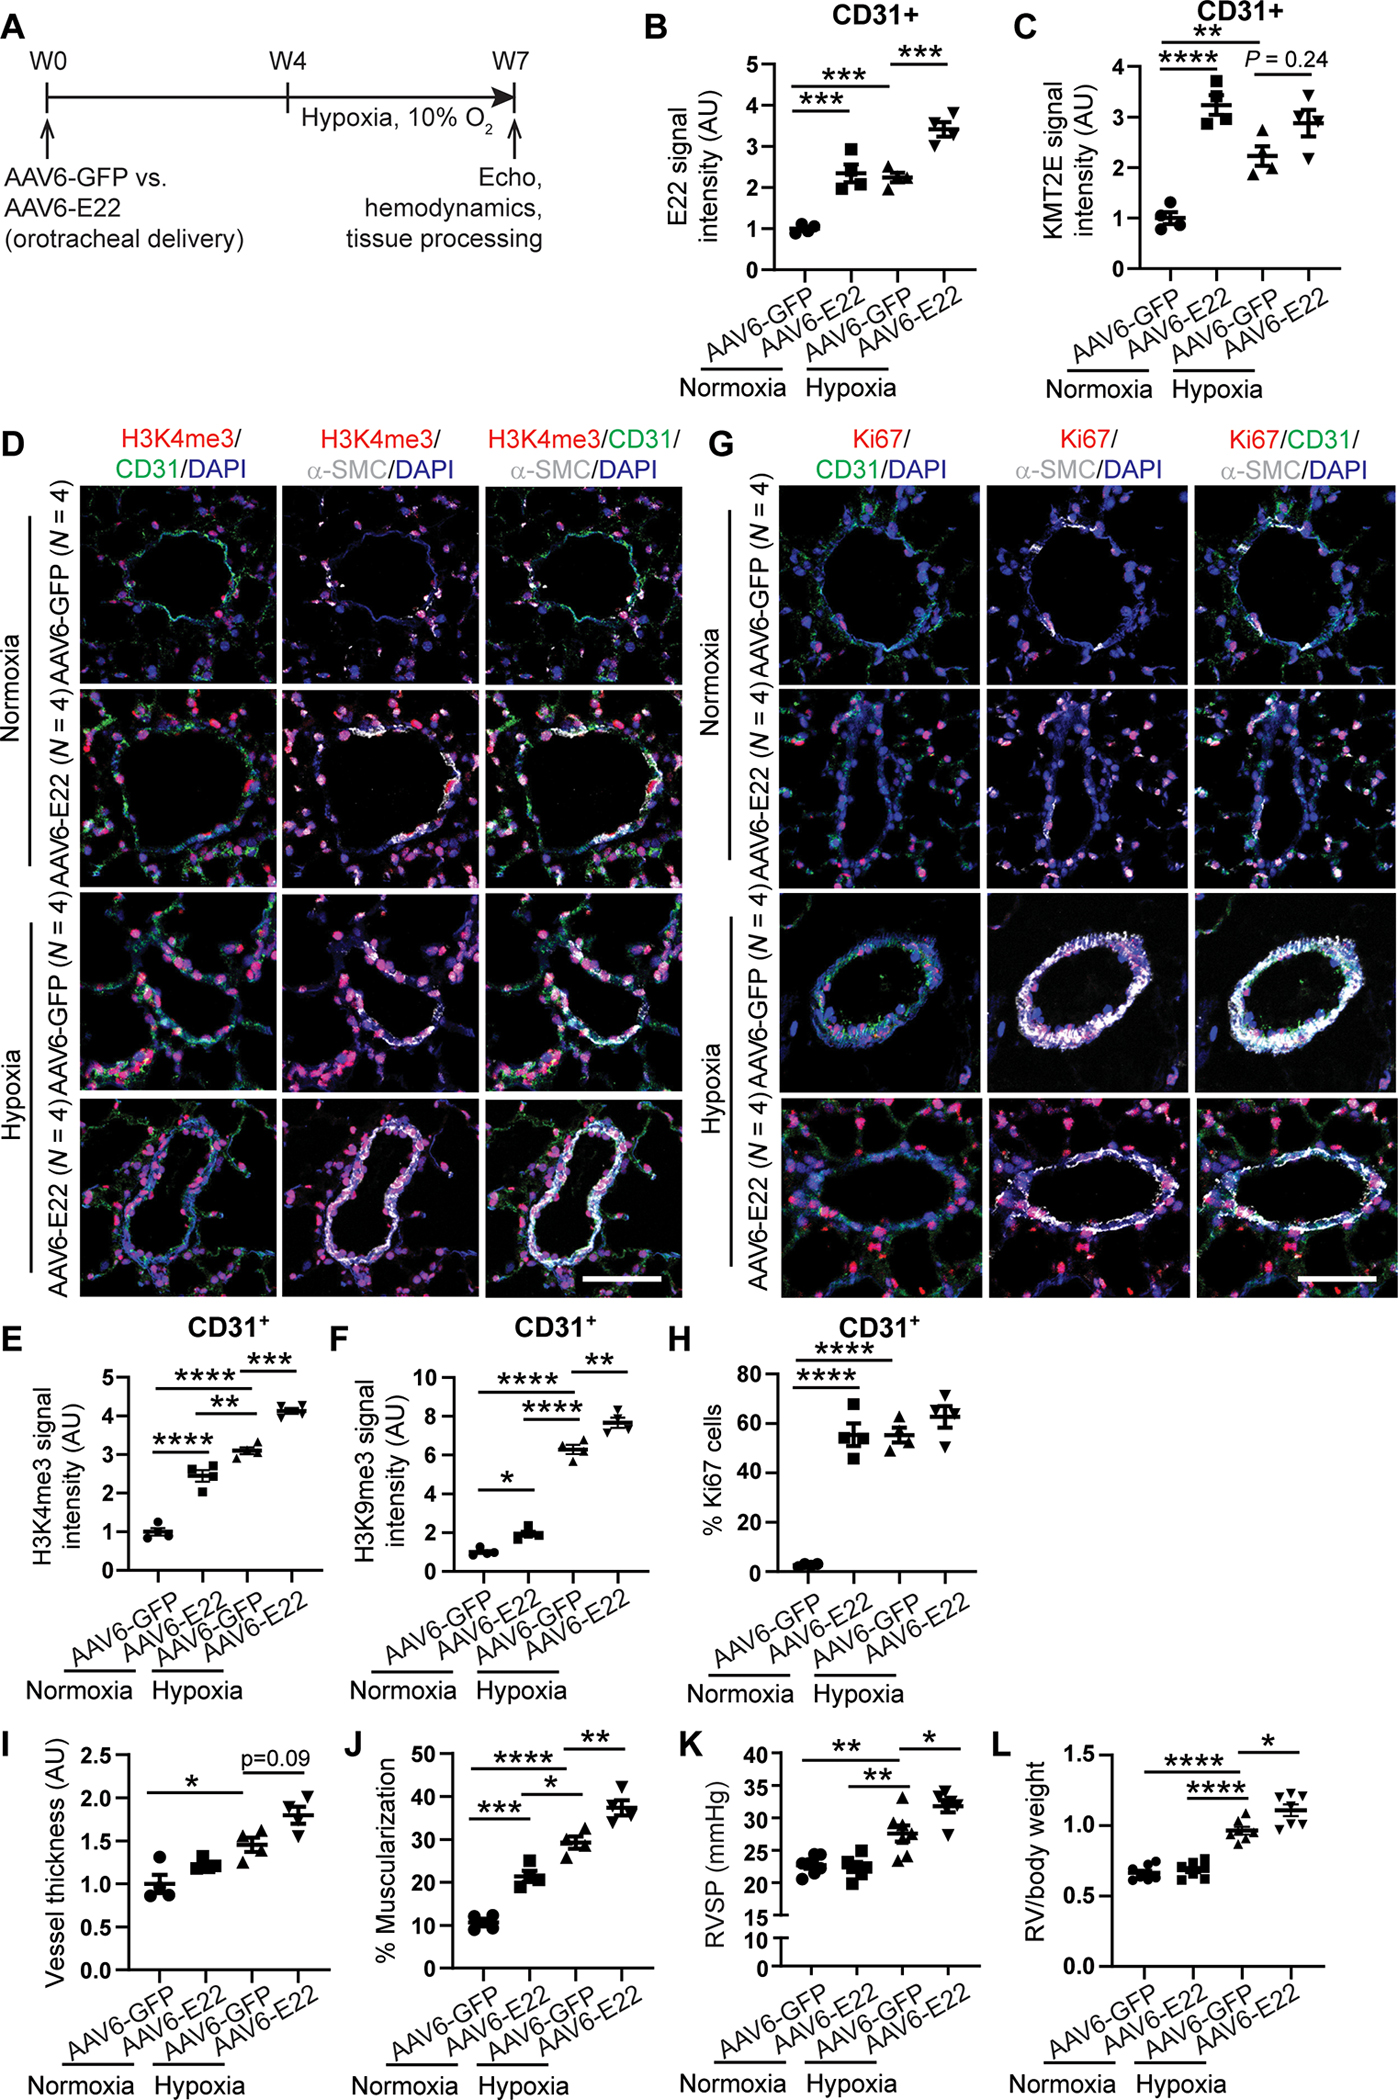
Fig. 6. Pulmonary vascular delivery of an AAV6-E22 transgene promotes PH in mice.

(A) experimental design for an AAV serotype 6 (AAV6) carrying either GFP or E22 transgene delivered orotracheally to wild type c57Bl6 mice 4 weeks before exposure to 3 weeks of chronic hypoxia. (B and C) E22 (B) and KMT2e (c) expression in mouse AAV6-GFP or AAV6-E22 mouse lung CD31+ endothelial cells by FISH and IF staining (n = 4; ***P < 0.001, two-way ANOVA followed by Bonferroni’s post hoc analysis; data represent mean ± SEM). (D to H) representative IF images for H3K4me3 (red; d) and Ki67 proliferation marker stains (red; G) in AAV6-E22 versus AAV6-GFP mouse lungs. IF quantifications in pulmonary CD31+ vascular endothelium of H3K4me3 (E), H3K9me3 (F), and Ki67 (H) expression (n = 4; *P < 0.05, **P < 0.01, ***P < 0.001, ****P < 0.0001, two-way ANOVA followed by Bonferroni’s post hoc analysis; data represent mean ± SEM). Scale bars, 50 μm. (I and J) Vessel thickness (I) and muscularization (J) for normoxic and hypoxic AAV6 E22 versus AAV6 GFP mouse lungs as indicated by α-S MA staining (white; d, G) (n = 4; *P < 0.05, **P < 0.01, ***P < 0.001, ****P < 0.0001, two-way ANOVA followed by Bonferroni’s post hoc analysis; data represent mean ± SEM). (K and L) right ventricular systolic pressure (RVSP, K) and RV/body weight mass index (l) in AAV6-E22 versus AAV6-GFP mice (n = 6 or 7; *P < 0.05, **P < 0.01, ****P < 0.0001, two-way ANOVA followed by Bonferroni’s post hoc analysis; data represent mean ± SEM).
