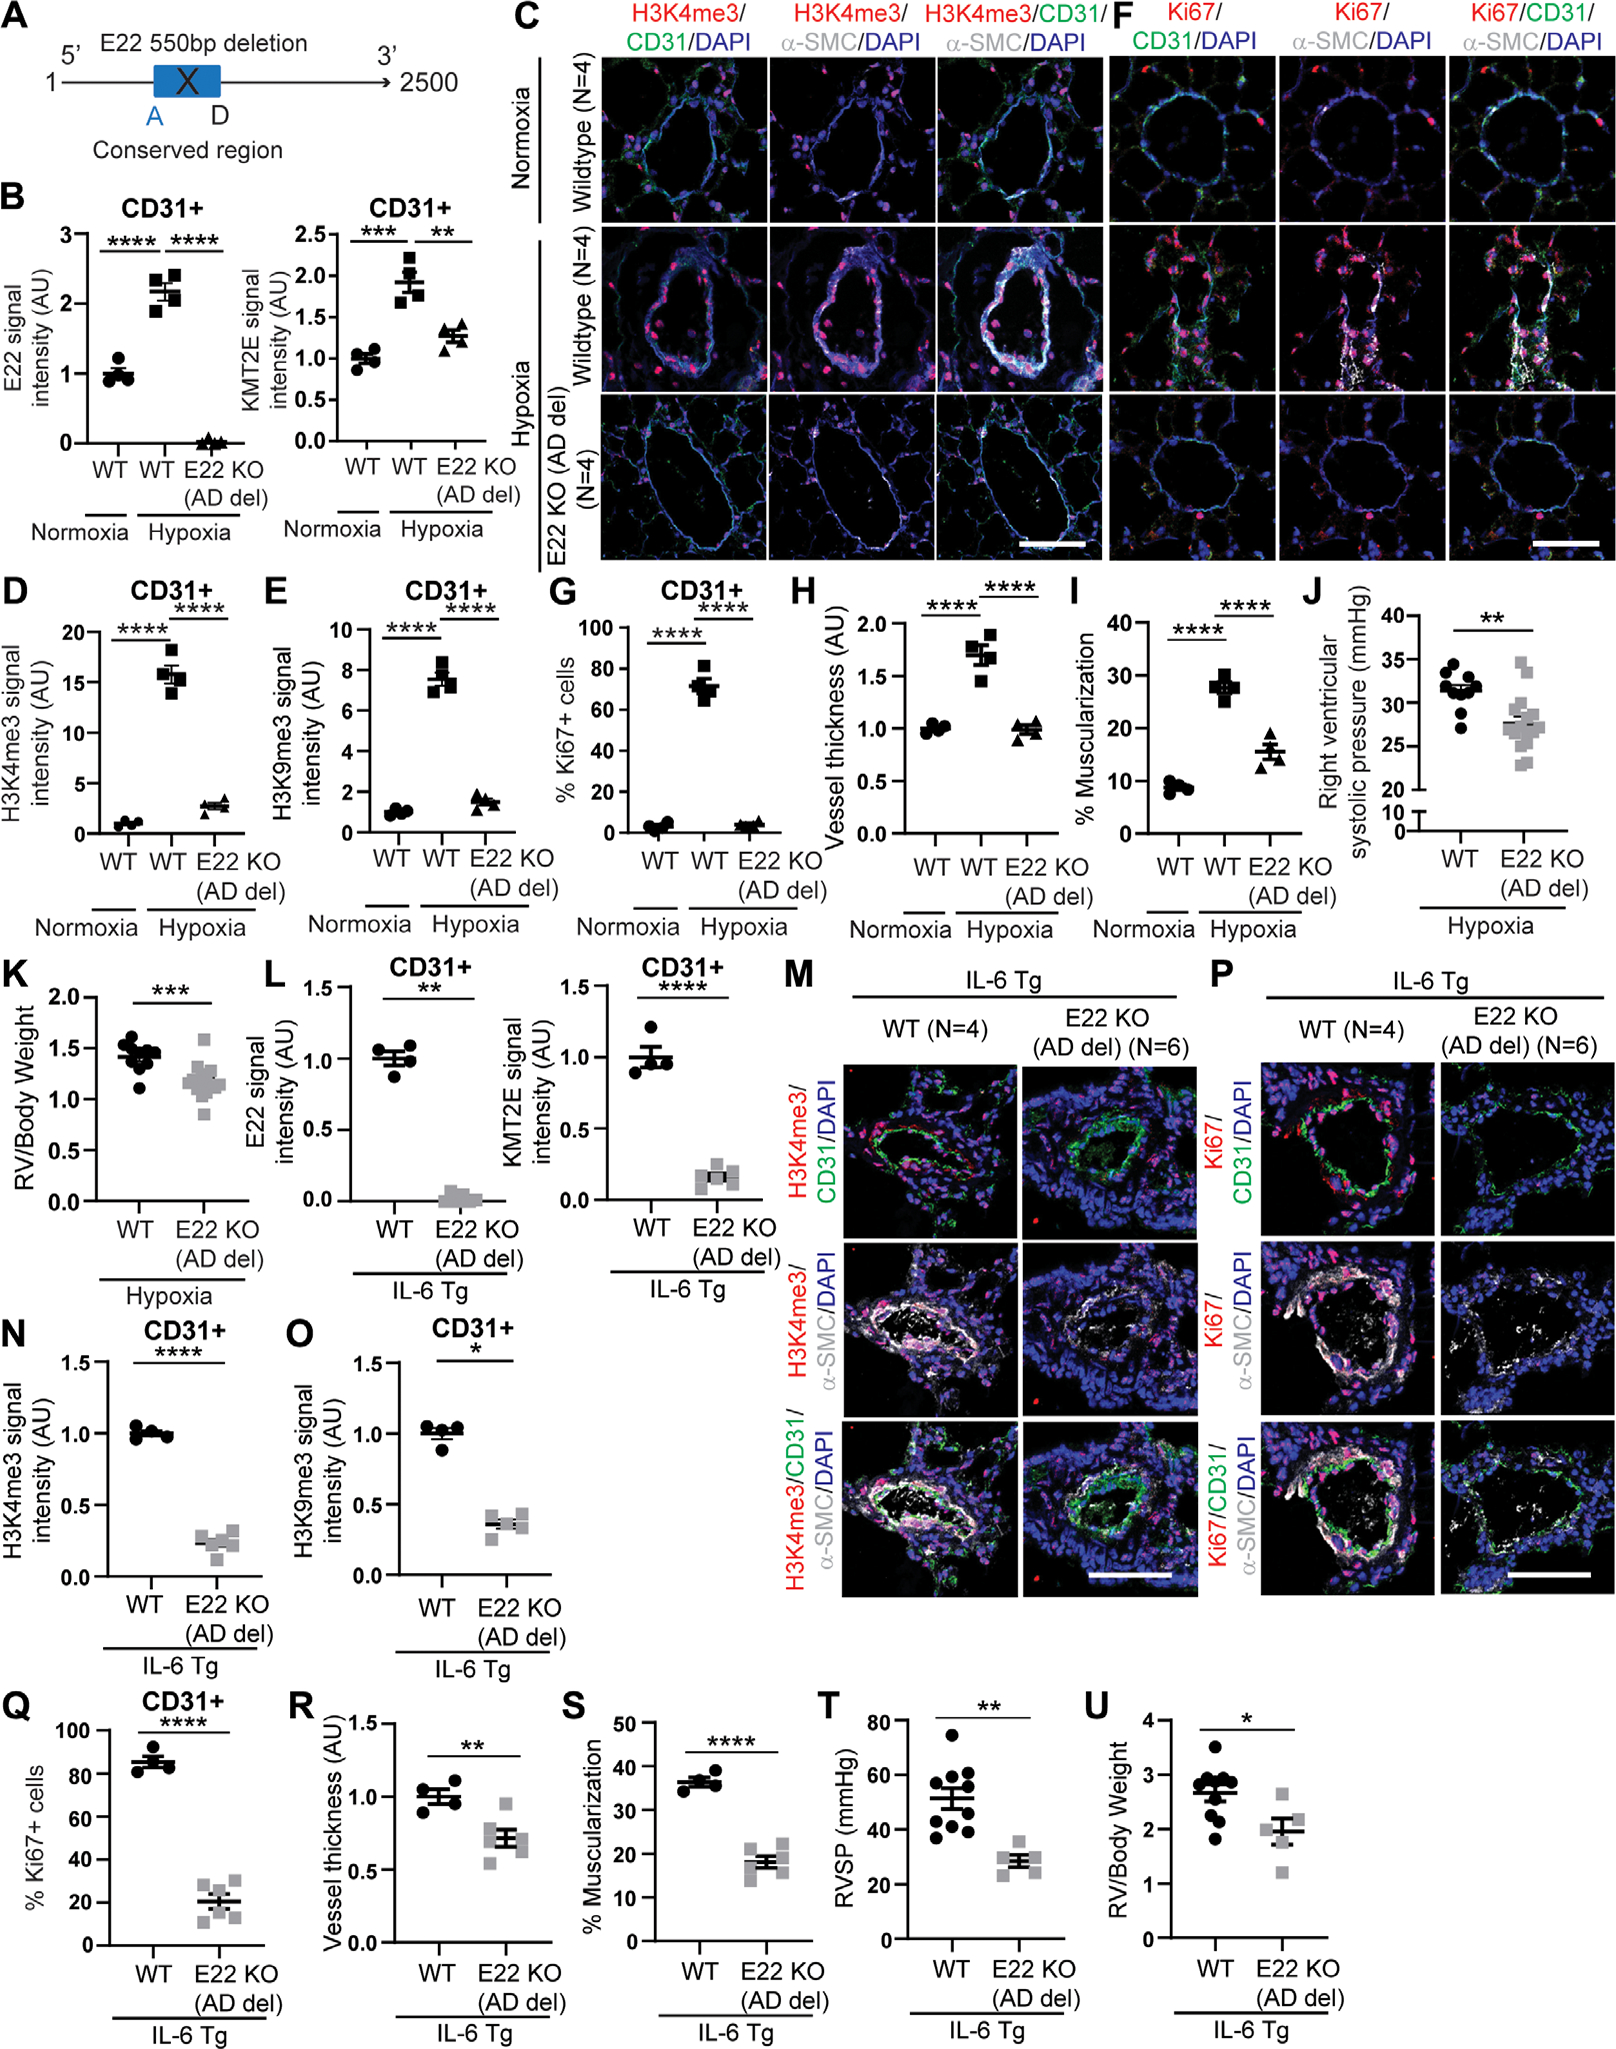
Fig. 7. E22 knockout mice display decreased KMT2E and H3K4me3 along with disease improvement in mouse models of WSPH groups 1 and 3 PH.

(A) CRISPR-Cas9 edited mice deficient in a conserved 500-bp sequence (denoted a and d) shared between human KMT2E-AS1 and mouse E22. (B) FISH and IF staining for full-length E22 and KMT2e expression in CD31+ lung endothelial cells of hypoxic E22 knockout (KO) mice with ad deletion versus wild-type (WT) controls (n = 4; **P < 0.01, ***P < 0.001, ****P < 0.0001, one-way ANOVA followed by Bonferroni’s post hoc analysis; data represent mean ± SEM). (C to G) representative IF images of H3K4me3 (red; C) and Ki67 (red; F) in hypoxic E22 (KO) mice versus wild-type (WT) controls. IF quantifications in CD31+ PAECs (green) for H3K4me3 (D), H3K9me3 (E), and Ki67 (G) expression (n = 4; ****P < 0.0001, one-way ANOVA followed by Bonferroni’s post hoc analysis; data represent mean ± SEM). Scale bars, 50 μm. (H to I) Vessel thickness (H) and muscularization (I) for E22 ad KO mice versus WT controls as indicated by α-SMA staining (white; C and F) (n = 4; ****P < 0.0001, one-way ANOVA followed by Bonferroni’s post hoc analysis; data represent mean ± SEM). (J and K) RVSP (J) and RV remodeling (RV/body weight ratio, K) in hypoxic E22 KO mice versus WT controls (n = 10 to 16; **P < 0.01, ***P < 0.001, unpaired Student’s t test; data represent mean ± SEM). (L) E22 and KMT2e expression in lung cd31+ endothelium of interleukin 6 transgenic (IL-6 TG) mice crossed onto E22 KO (ad deletion) mice by FISH and IF staining (n = 4 to 6; **P < 0.01, ****P < 0.0001, Mann-Whitney test for E22, unpaired Student’s t test for KMT2e; data represent mean ± SEM). (M to Q) representative IF images of h3K4me3 (red; M) and Ki67 (red; P). IF quantifications of h3K4me3 (N), h3K9me3 (O), and Ki67 (Q) in hypoxic IL-6 TG E22 KO mouse lung endothelium versus hypoxic IL-6 TG PAH mice [n = 4 to 6; *P < 0.05, ****P < 0.0001, unpaired Student’s t test for h3K4em3 (N) and Ki67 (Q), Mann-Whitney test for H3K9me3 (o); data represent mean ± SEM]. Scale bars, 50 μm. (R and S) Vessel thickness (R) and muscularization (S) for IL-6 TG E22 KO mice versus WT controls (n = 4 to 6; **P < 0.01, ****P < 0.0001, unpaired Student’s t test; data represent mean ± SEM). (T and U) RVSP (T) and RV remodeling (U) in IL-6 TG e22 KO mice versus controls (n = 5 to 10; *P < 0.05, **P < 0.01, unpaired Student’s t test; data represent mean ± SEM).
