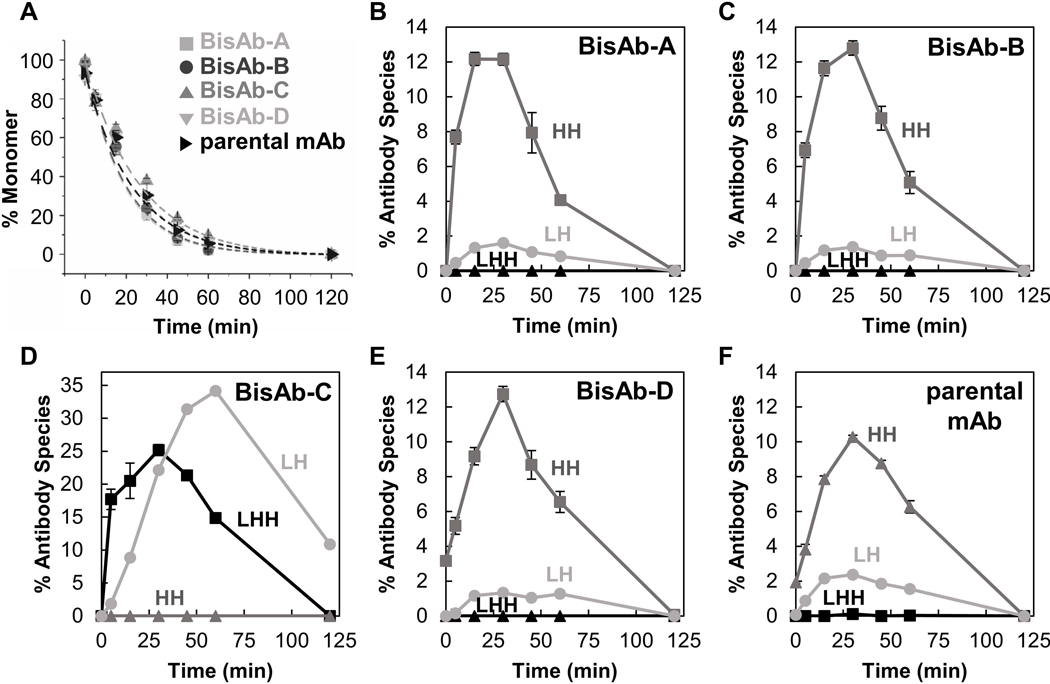
Figure 3.

Antibody reduction kinetics (a) and quantification of intermediate species (b–f) generated during reaction with the thioredoxin enzyme system. Kinetic curves were fit to a first-order exponential decay. Intermediate fragments include those missing one light chain (LHH, black squares), heavy chain dimers (HH, dark gray triangles), and half-antibodies (LH, light gray circles). Error bars represent the standard deviation of triplicates
