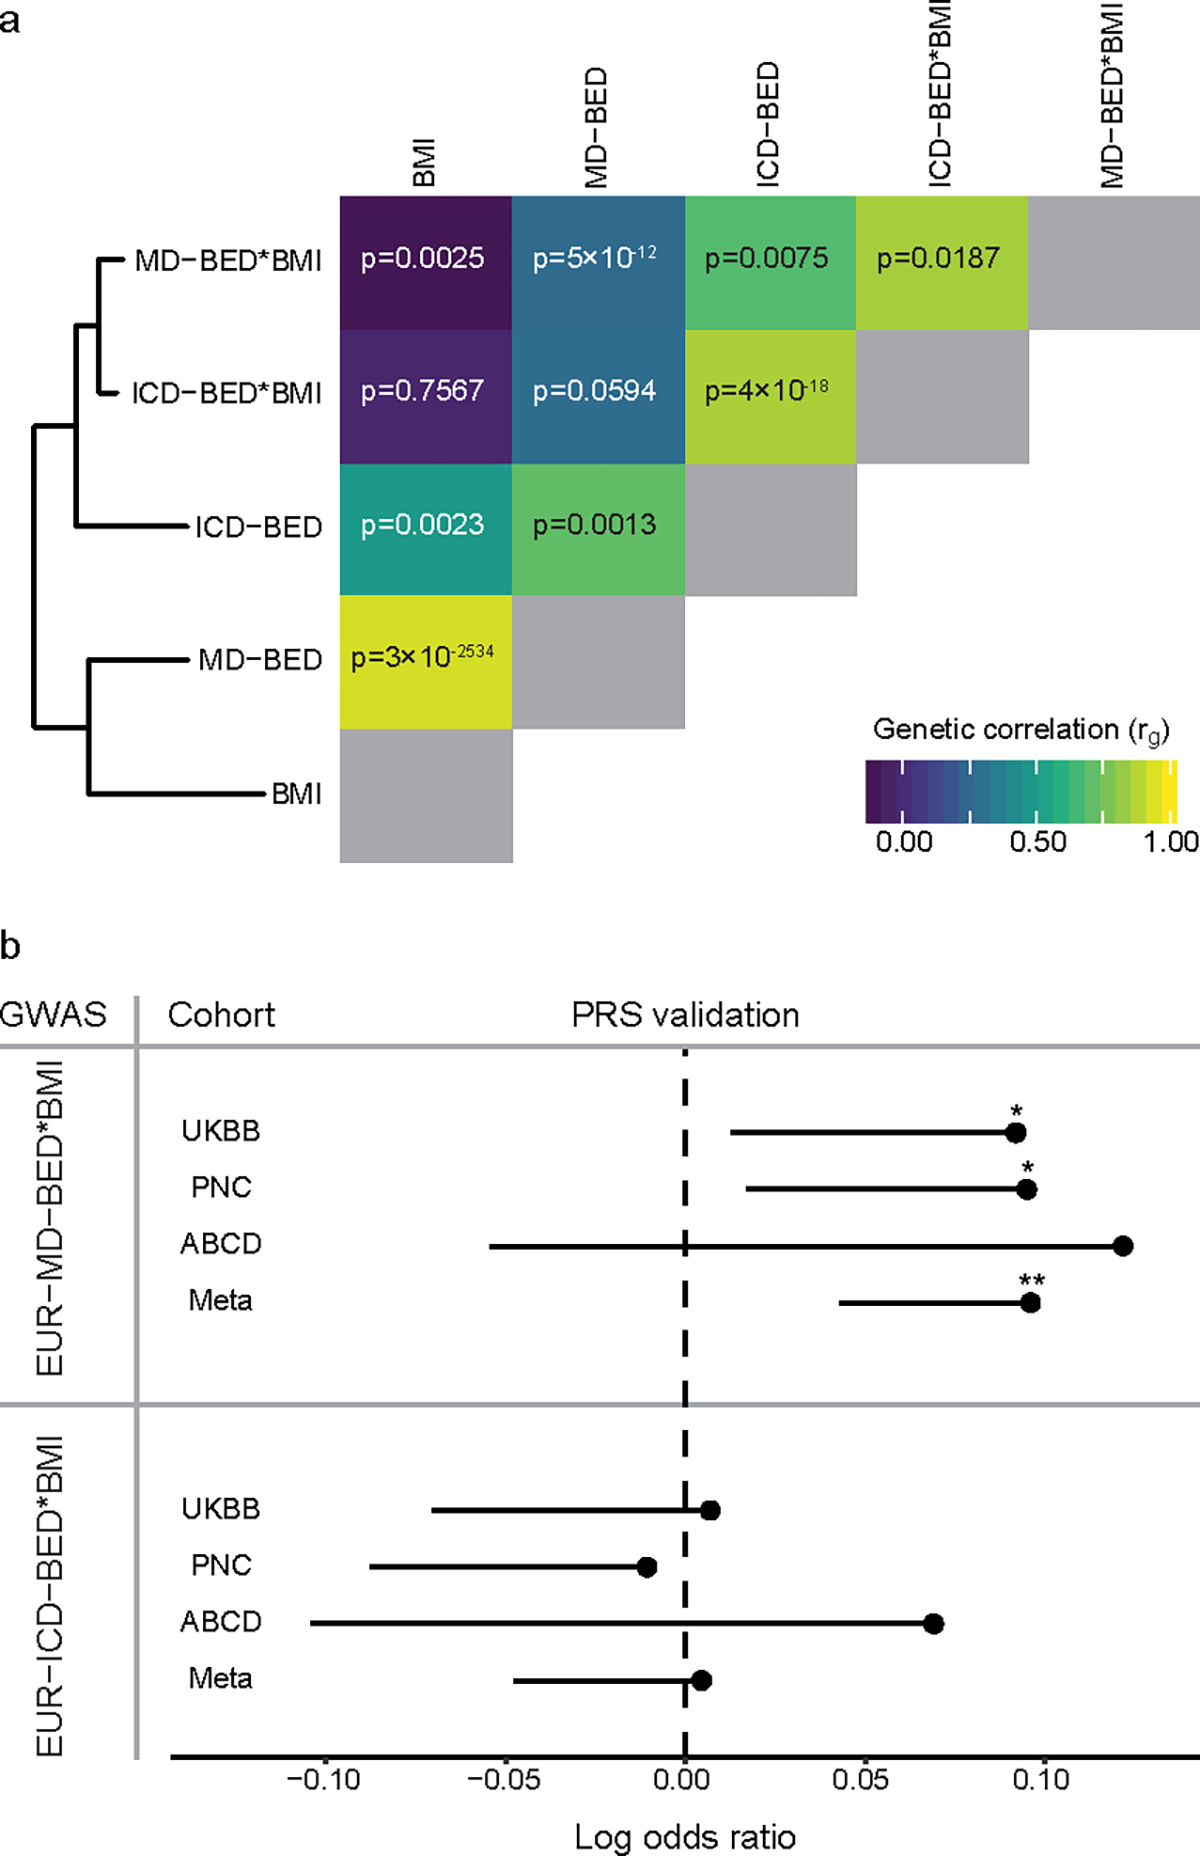
Fig. 3: Validation of the MD-BED phenotype.

a, On the left is a hierarchical clustering of five EUR BED-related phenotypes. On the right is a heat map of the genetic correlation matrix. The diagonal genetic correlation entries in gray represent a correlation of 1 between each GWAS and itself. Genetic correlation values for each comparison are shown on the heat map. b, PRS validation of EUR-MD-BED*BMI and EUR-ICD-BED*BMI GWAS with UKBB (cases = 461), PNC (cases = 531), ABCD (cases = 94) and a meta-analysis of those cohorts. The MVP (vertical) and external (horizontal) cohorts are shown on the y axis. The mean log odds ratio for the PRS predictor is shown on the x axis. Confidence intervals are one-sided standard errors and uncorrected P values are generated using a one-sided Wald Z-test. *p < 0.05. **p < 0.01. P values for validating the MD-BED*BMI PRS are: UKBB, p = 0.03; PNC, p = 0.02; ABCD, p = 0.13; Meta, p = 0.001. P values for validating the BED-ICD PRS are: UKBB, p = 0.44; PNC, p = 0.59; ABCD, p = 0.26; Meta, p = 0.44.
