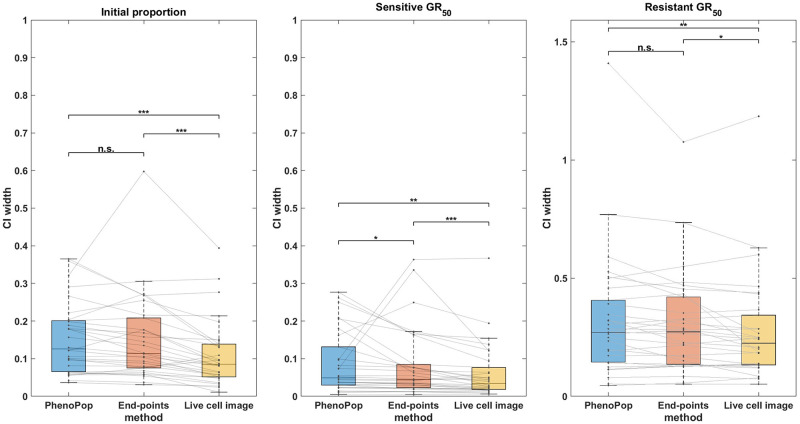
Fig 12. Comparison of the CI widths of the three estimators using the three different estimation methods, when the observation noise parameter is set to c = 100.
The y-axis represents the CI width. The box plot summarizes the results across 30 different datasets. The significance bar indicates the p-values derived from the Wilcoxon rank-sum test, with significance levels denoted as *** ≤ 0.001 ≤ ** ≤ 0.01 ≤ * ≤ 0.05. This figure demonstrates that the advantages of the live cell image method in estimation precision are preserved even when the standard deviation of observation noise is 10% of the initial cell count.

