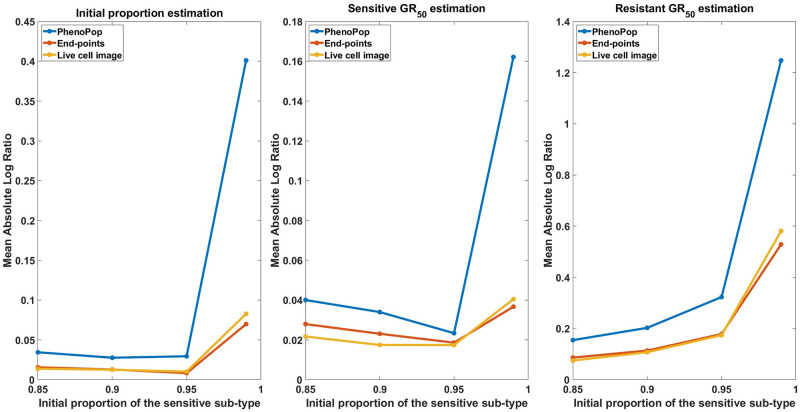
Fig 15. Estimation error of with respect to varying resistant initial proportions.
The metric of estimation error is the mean absolute log ratio across 100 simulated datasets, each generated from a distinct parameter set. The value of ps in these 100 generating parameter sets was assigned to 4 different values in the set to generate the line plots. Three different line plots correspond to three different methods, as indicated by the figure legends. This figure demonstrates the advantages of estimation accuracy provided by the newly proposed methods when the initial proportion of the resistant subpopulation decreases toward 0.

