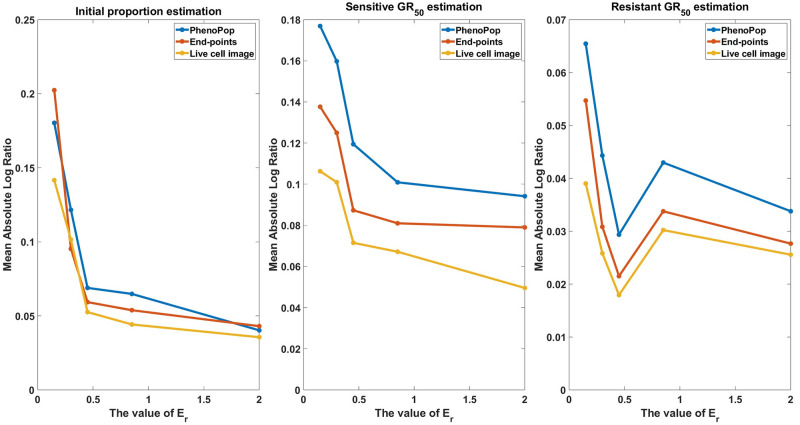
Fig 17. Estimation error of with respect to varying similarity between subpopulation drug sensitivities.
The metric of estimation error is the mean absolute log ratio across 80 simulated datasets, each generated from a distinct parameter set. The value of Er in these 80 generating parameter sets was assigned to 5 different values in the set to generate the line plots. Three different line plots correspond to three different methods, as indicated by the figure legends. This figure demonstrates that the estimation accuracy of the three methods improves as the discrepancy of drug sensitivity between the two subpopulations increases, with the live cell image method exhibiting the smallest average error among the three methods.

