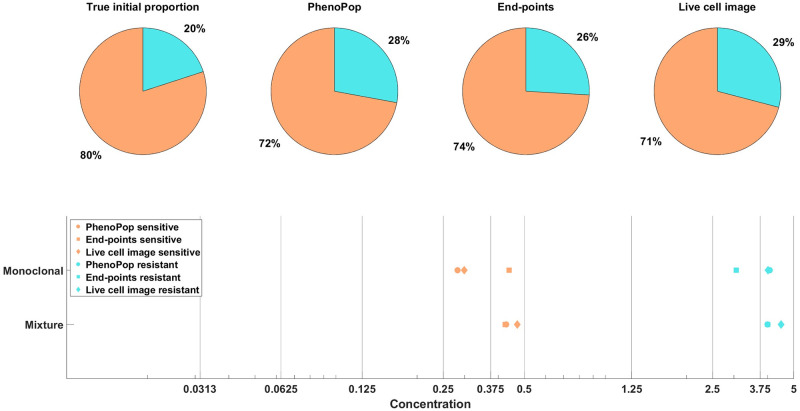
Fig 18. Estimation of the initial proportion and GR50 for 2 subpopulations from the mixture (BF41), and the monoclonal (SENSITIVE500, RESISTANT250) datasets using all three methods (PhenoPop, End-points, Live cell image).
True initial proportion is obtained from the initial setting of the BF41 dataset, with a 4: 1 between sensitive and resistant cells. The estimated initial proportions are labeled according to their respective methods. True GR50 are estimated from monoclonal data and denoted as ‘Monoclonal’ from all three methods, while the estimated GR50 are labeled as ‘Mixture’. Each shape in the GR50 estimation corresponds to a method, circle for PhenoPop, square for End-points, and diamond for Live cell image. Each color in the plot represents a distinct subpopulation: orange for sensitive and blue for resistant.

