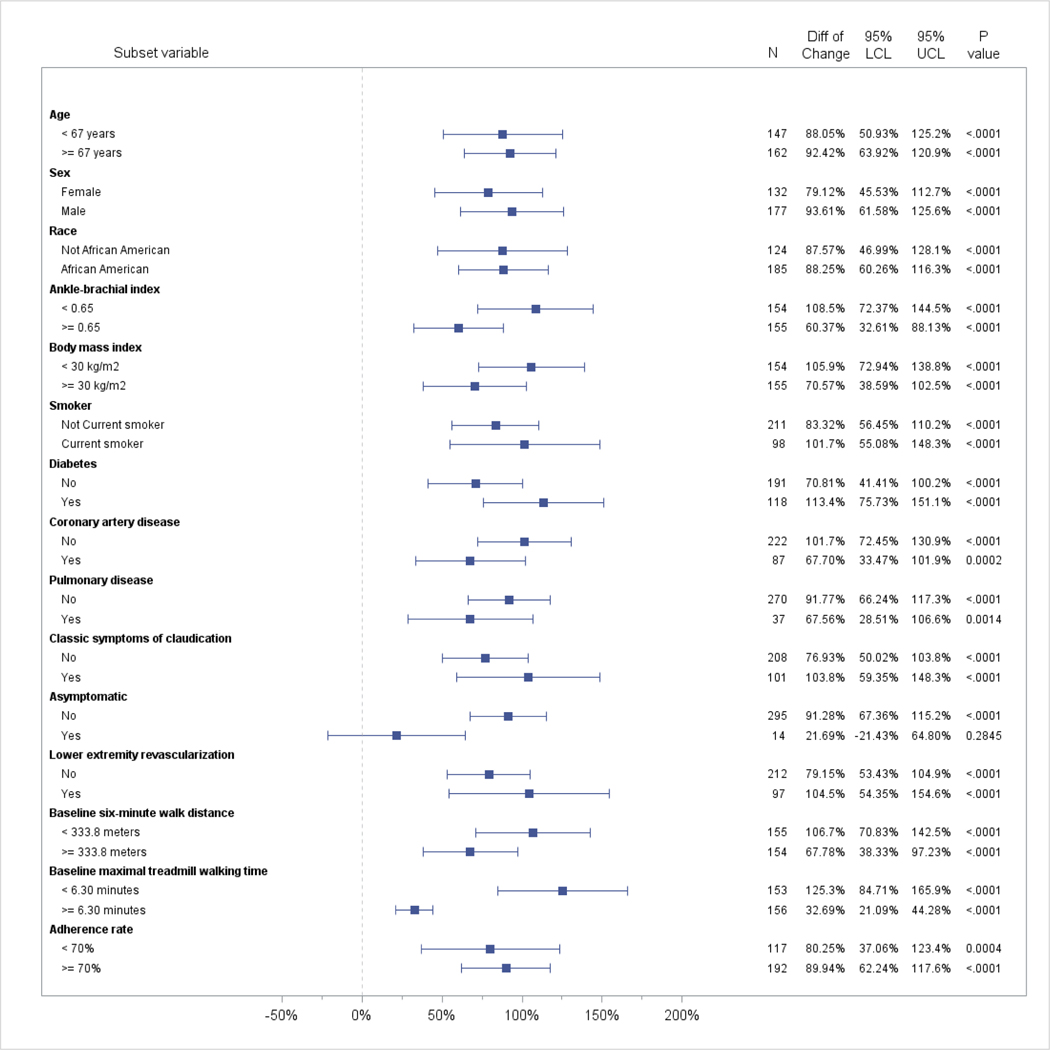
Figure 2b. Percent change in treadmill walking time between the supervised treadmill exercise vs. control groups, according to baseline characteristics.
*Groups for age, ankle brachial index, and body mass index were defined according to the baseline median value for each variable. P values shown represent the within-group statistical significance of change in the supervised exercise therapy group, relative to control.
* Point estimates represent the difference in change in treadmill walking time between the SET and control groups at 6-month follow-up. Groups for age, ankle brachial index, and body mass index were defined according to the baseline median value for each variable. P values shown represent the within-group statistical significance of change in the supervised exercise therapy.

