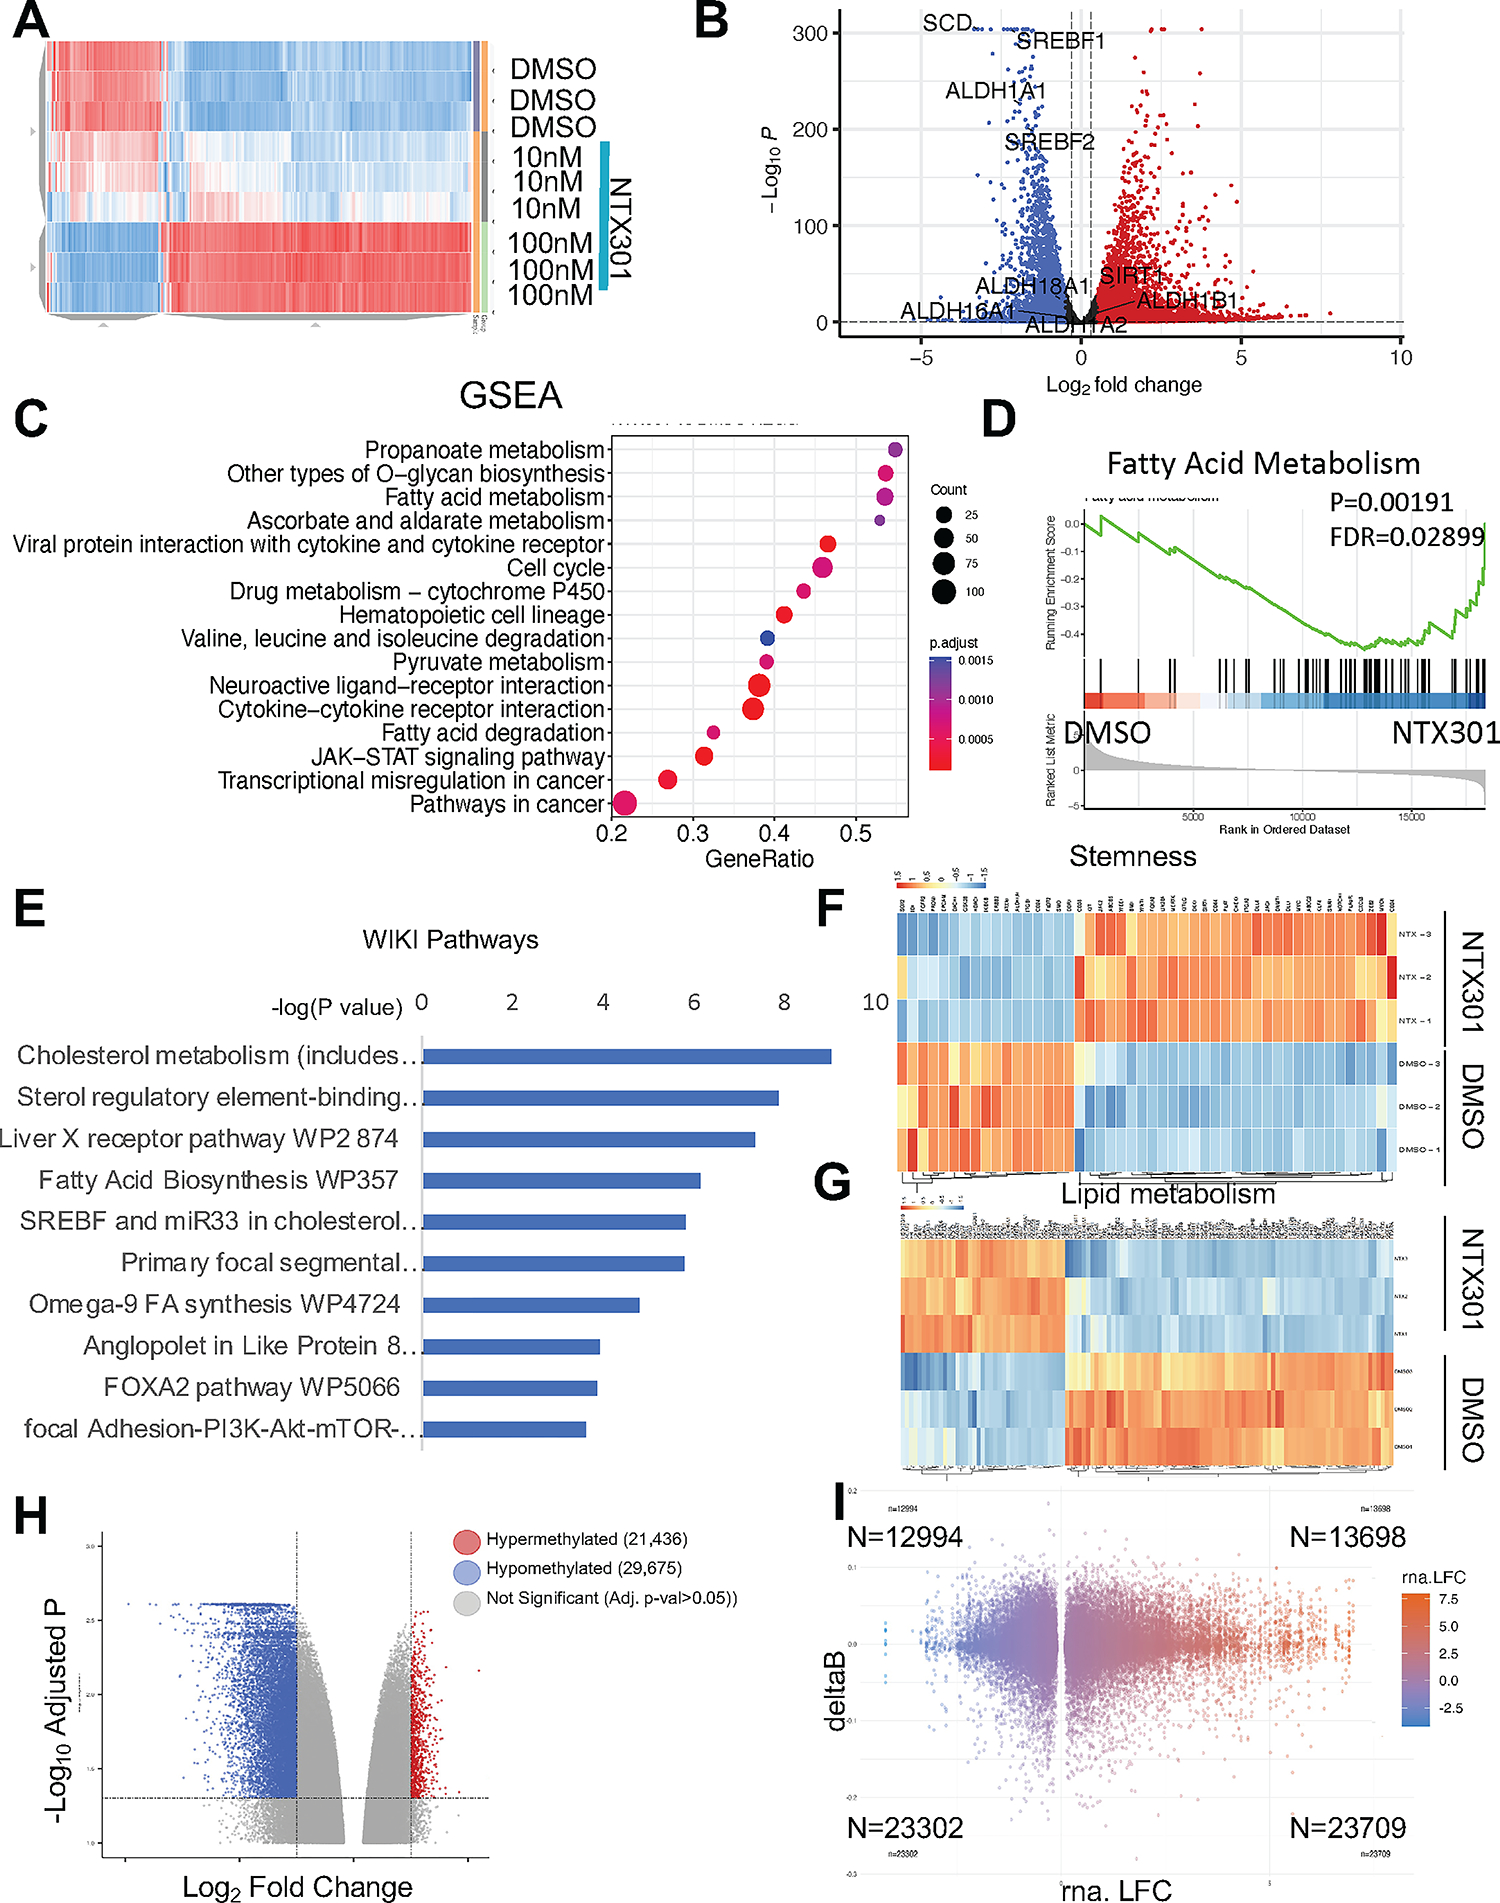
Figure 2. NTX-301 induced transcriptome and methylome reprogramming in OC cells.

(A) Hierarchical clustering heatmap for DEGs (FDR<0.05) measured by RNAseq in OVCAR5 cells treated with NTX-301. Rows represent replicates (n=3/group). (B) Volcano plot of DEGs comparing OVCAR5 cells treated with NTX-301 100nM with DMSO. NTX-301-induced upregulated genes are shown in red and downregulated gene are shown in blue. (C) Dot plot of Gene Set Enrichment Analysis (GSEA) of DEG shows the top sixteen KEGG pathways in OVCAR5 cells treated with NTX-301 (100nM). The size of the circles represents the counts of DEGs within each term, and the color of the circles represents statistical significance. Gene ratio (x axis) is the relative number of DEGs per term. (D) GSEA enrichment plots for the KEGG “fatty acid metabolism” gene set using the gene expression profiles of OVCAR5 cells treated with NTX-301 (100nM) vs. DMSO (n=3). (E) WikiPathways analysis of downregulated DEGs in OVCAR5 OC cells treated with NTX-301 (100nM) vs. DMSO shows the top significantly enriched molecular pathways. Gene expression was measured by RNA-seq (n=3 replicates per group). (F, G) Hierarchical clustering heatmap for DEGs (FDR<0.05) stemness-related genes (F) (23) and lipid metabolism (G) in OVCAR5 cells treated with NTX-301 (100nM) vs. DMSO. Rows represent replicates (n=3/group). (H) Volcano plot of DMPs comparing OVCAR5 cells treated with NTX-301 vs control. Hypermethylated CpG probes are shown in red (positive delta Beta) and hypomethylated CpG probes are shown in blue (negative delta Beta). (I) Scatter plot shows overlapping DEGs associated with promoter-associated DMPs in response to treatment with NTX-301 (100nM, 3days; n = 3 replicates per group). A total of 23,709 genes were both upregulated and were associated with hypomethylated CpG sites (lower right quadrant), =whereas 23,302 genes were downregulated and were associated with hypomethylated CpGs (lower left quadrant).
