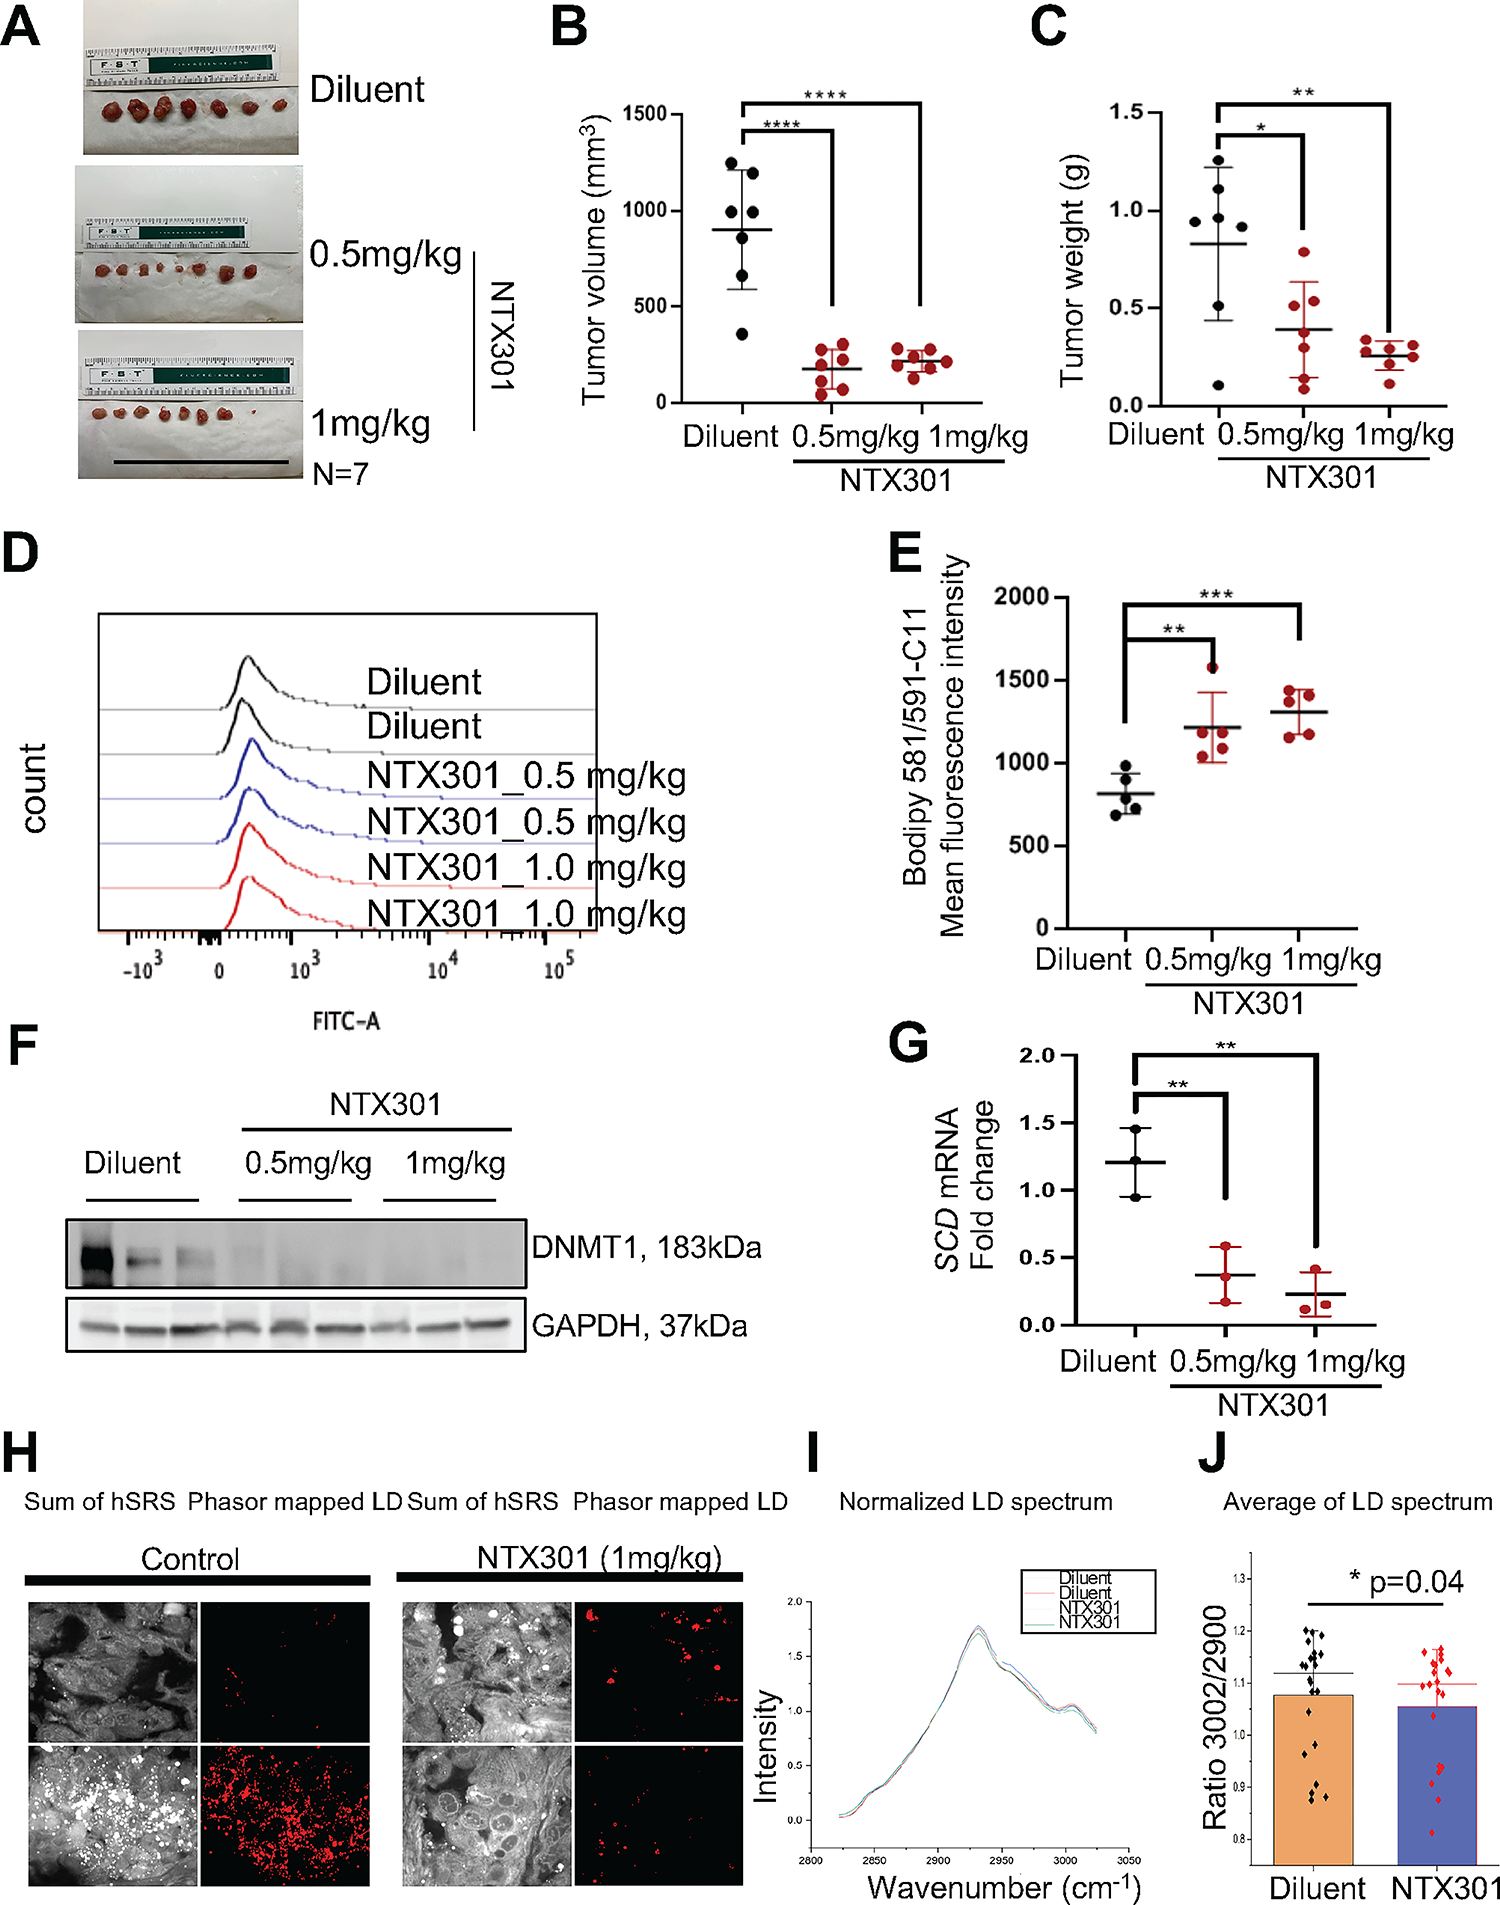
Figure 6. NTX-301 inhibits OC tumor growth by targeting lipid metabolism.

(A-C) Images of harvested SQ xenografts (A) and means ± SD of tumor volumes (B) and tumor weights (C) from mice treated with diluent or NTX-301. (D, E) Representative histograms (D) and mean (± SD, n = 5) fluorescence intensity of BODIPY 581/591-C11 (E) in cells obtained from OVCAR5 xenografts in the experiment described in (A). (F) Protein levels of DNMT1 and GAPDH (loading control) measured by western blotting in xenograft tumors (n = 3 per group) from the experiment described in (A). (G) mRNA expression levels of SCD in xenograft tumors collected from indicated groups and measured by qRT-PCR (n = 3 per group). (H) Representative hSRS images of xenograft sections from mice treated with diluent or NTX-301 (1mg/ml), and corresponding lipid droplets phasor maps. Scale bars: 20 μm. (I) Average hSRS spectra of sections of xenografts from mice treated with diluent or NTX-301 (1mg/ml), and normalized to 2900 cm−1. (J) Box-scatter plot of the ratio of hSRS peaks at 3002 cm−1 and 2900 cm−1. Each data point represents one field of view in a tissue section, bars indicate means ± SD, p=0.04. *p<0.05; **p<0.01; ***p<0.001.
