
Figure 2. ORIC-101 Pharmacodynamics.
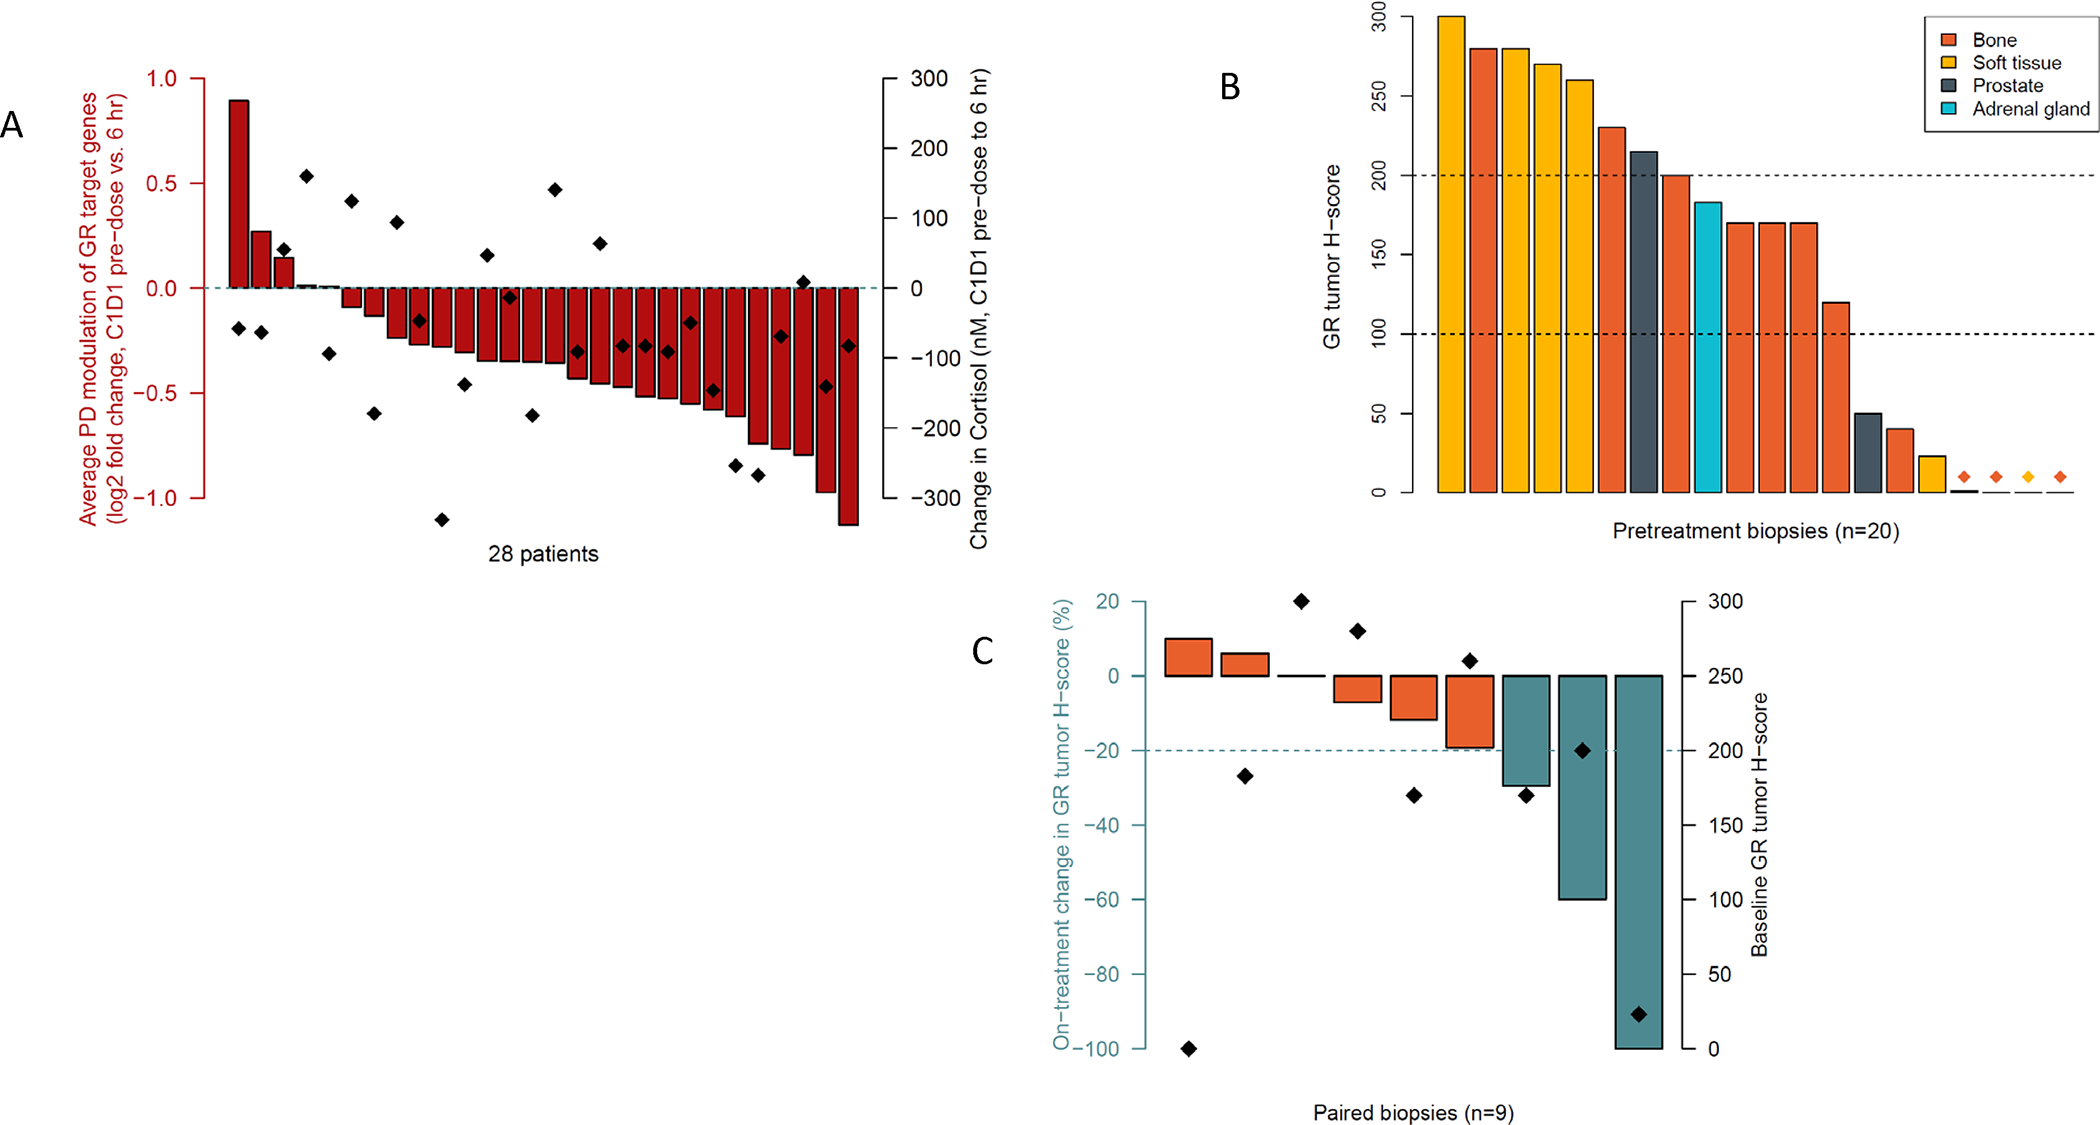
(A) PD modulation after one dose of ORIC-101 in dose expansion patients treated at the RP2D. Results are displayed as the average fold change in the expression of GR target genes FKBP5, GILZ and PER1 from pre-dose to 6 hours post-dose (in red). Diamonds represent change in cortisol pre-dose to 6 hours post-dose. (B) Barplot with GR IHC H-scores in tumor cells in pretreatment biopsies, colored by biopsy site, from dose expansion patients treated at the RP2D. Low GR expression was defined as H-score <100, and high GR expression as H-score ≥200. (C) Barplot with proportional on-treatment change in GR tumor H-score, defined as (on-treatment GR H-score – pretreatment GR H-score) / pretreatment GR H-score, for 9 dose expansion patients with matched tumor biopsies from the same biopsy site. Diamonds represent GR tumor H-score at pretreatment.