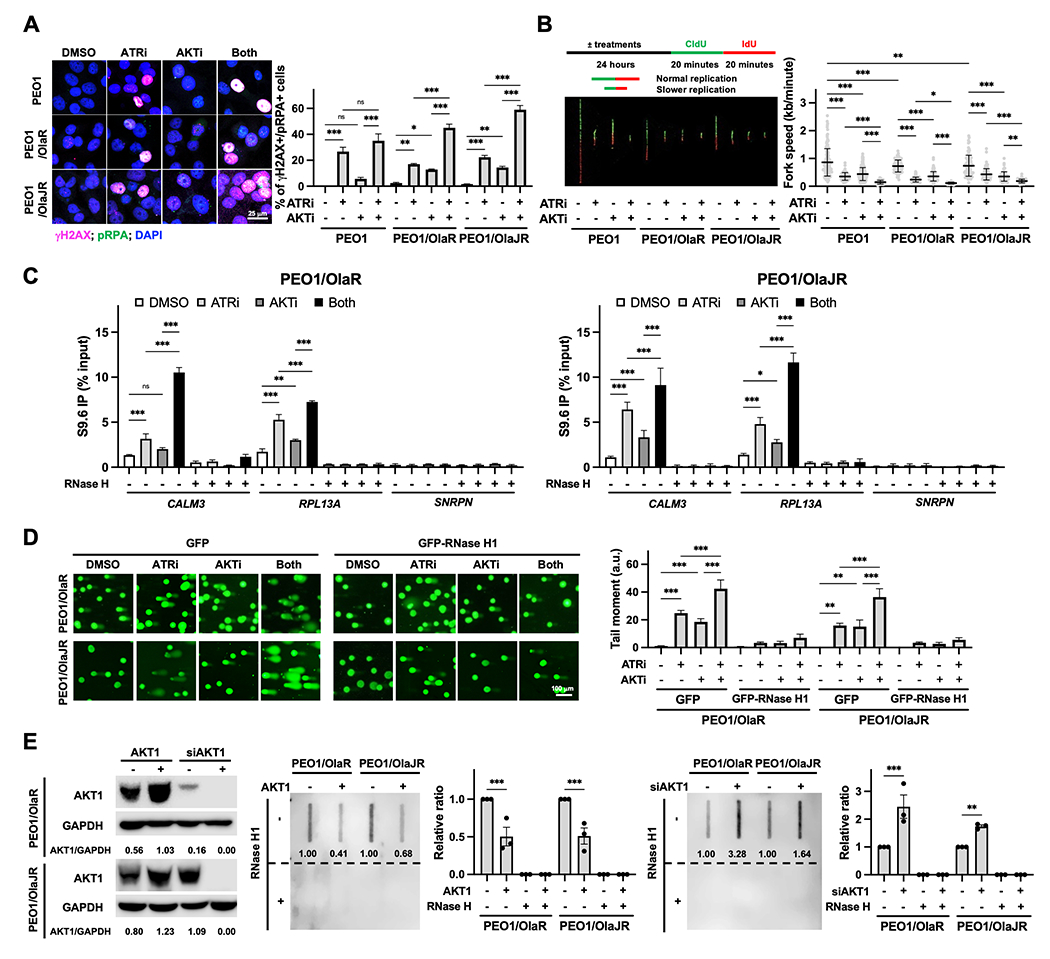
Figure 2. AKTi enhances ATRi-induced DNA damage and R-loop accumulation.

A, Immunofluorescence staining of γH2AX (pink; DNA damage marker) and pRPA (green; stalled replication fork marker) were performed to examine replication stress (n = 3). Cells were treated with ATRi ceralasertib (1 μM) and AKTi capivasertib (10 μM) for 48 hours. Representative images are shown (left). The percentage of double-positive cells, indicative of replication stress, is plotted (right). B, DNA fiber assays were performed to assess replication fork dynamics (n = 3). The schematics (left, top) and representative fibers (left, bottom) are shown. Average replication fork speeds in each group are shown (right). C, DRIP was conducted using the S9.6 monoclonal antibody in PARPi-resistant cells treated with ATRi and/or AKTi. RNase H treatment was used as a negative control. The qPCR analysis of R-loop positive foci of CALM3 and RPL13A genes and R-loop negative SNRPN gene (n = 3) was plotted using the percentage of input. D, Alkaline comet assay (n = 3) in cells treatment with ATRi ceralasertib (1 μM) and/or AKTi capivasertib (10 μM) in the presence of 20 μM pan-caspase inhibitor Z-VAD-FMK for 72 hours with GFP or GFP-RNase H1 overexpression. Representative immunofluorescence images of the comet tail are shown (left). The tail moment is plotted (right). E, Effect of AKT1 overexpression or knockdown on R-loop formation (n = 3). Cells were transfected with siAKT1 (25 nM) or HA-tagged AKT1 (2 mg) for 72 hours. The overexpression or knockdown efficiency of AKT1 was assessed by immunoblotting and GAPDH was used as a loading control. Densitometric values of AKT1 relative to GAPDH are shown (left). Dot-blot analysis of R-loops using S9.6 antibody in genomic DNA from transfected cells (right). Ratios relative to control group are shown. Bottom panels show the same analysis using genomic DNA after RNase H1 treatment were used as negative control. Data were analyzed using one-way ANOVA test and shown as mean ± SEM. *, P < 0.05; **, P < 0.01; ***, P < 0.001; ns, not significant.
