
FIGURE 1.
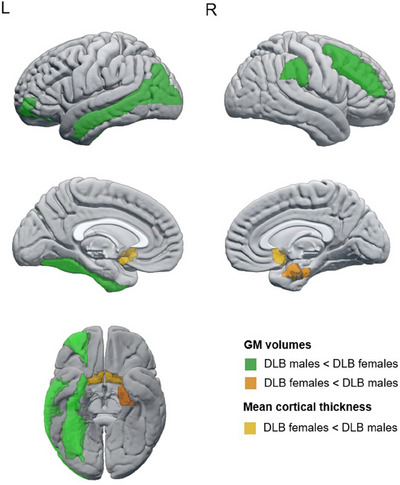
Regions showing statistically significant sex differences in automated estimations of regional atrophy in probable DLB. Regions colored in green showed a smaller GM volume in DLB males than in DLB females; regions colored in orange showed smaller/thinner estimations in DLB females than DLB males, the darker one for GM volumes and the lighter for mean cortical thickness. DLB, dementia with Lewy bodies; GM, gray matter; L, left; R, right.