
Figure 3.
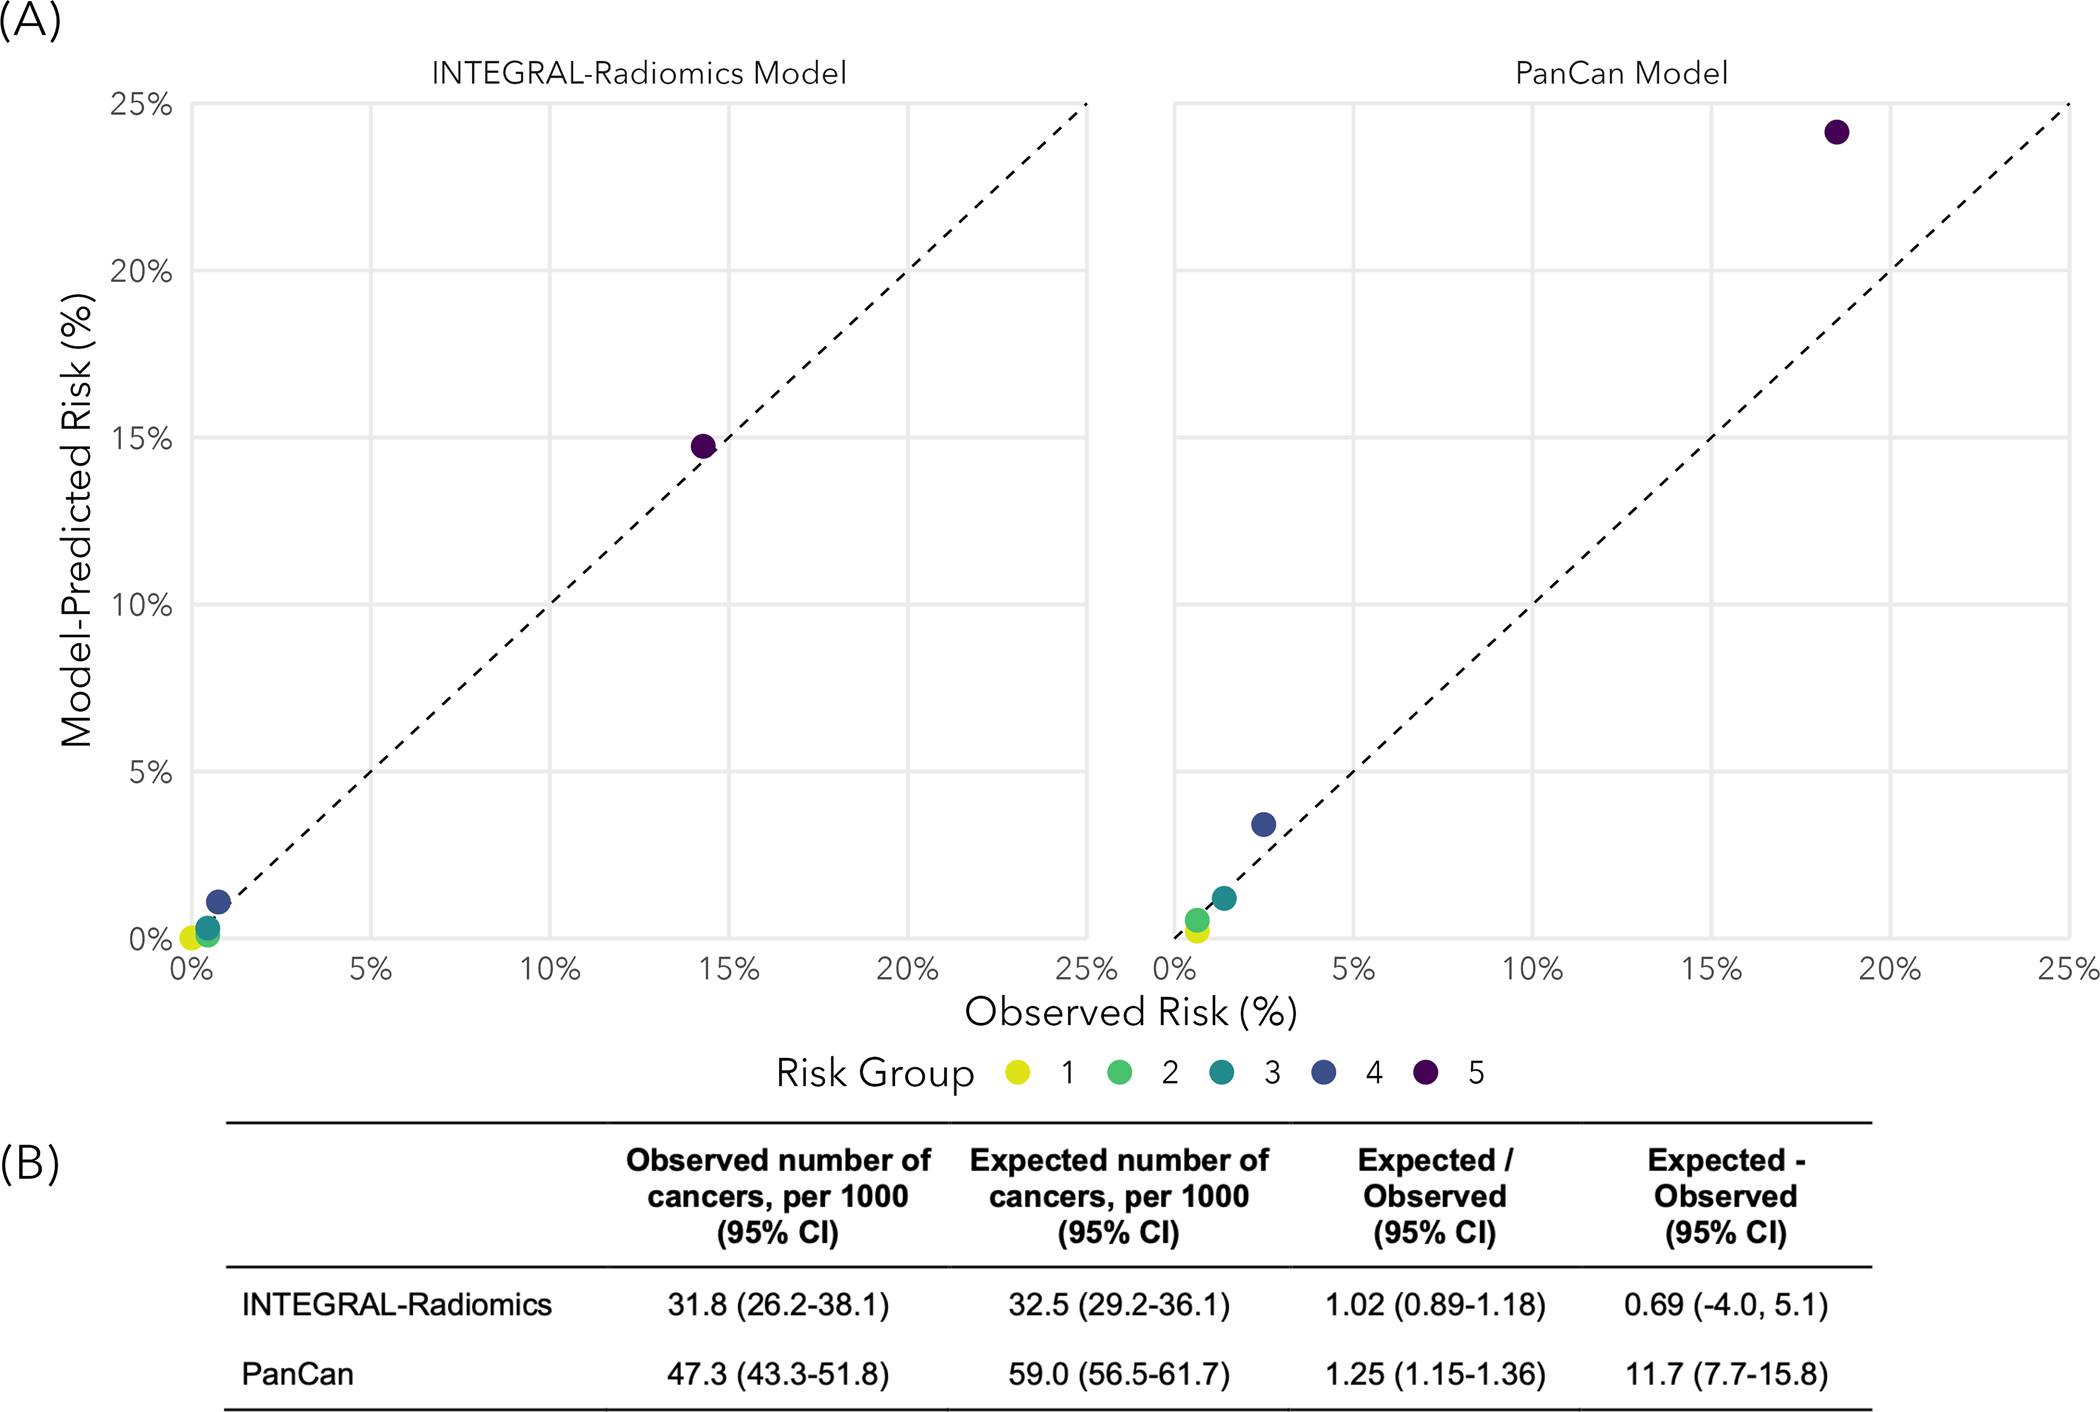
Calibration of our INTEGRAL-Radiomics model and the PanCan model (McWilliams et al., 2013) in hold-out test-data. (A) Model-predicted risks versus observed risks across quintiles of model-predicted risks. The diagonal dashed line indicates perfect calibration. (B) Observed and expected (model-predicted) number of malignant pulmonary nodules (per 1,000 nodules) including the calibration ratio (Exp / Obs) and difference (Exp - Obs). Calibration ratios less than 1 (or differences less than 0) indicate underestimation of risk and ratios greater than 1 (or differences greater than 0) indicate overestimation of risk.