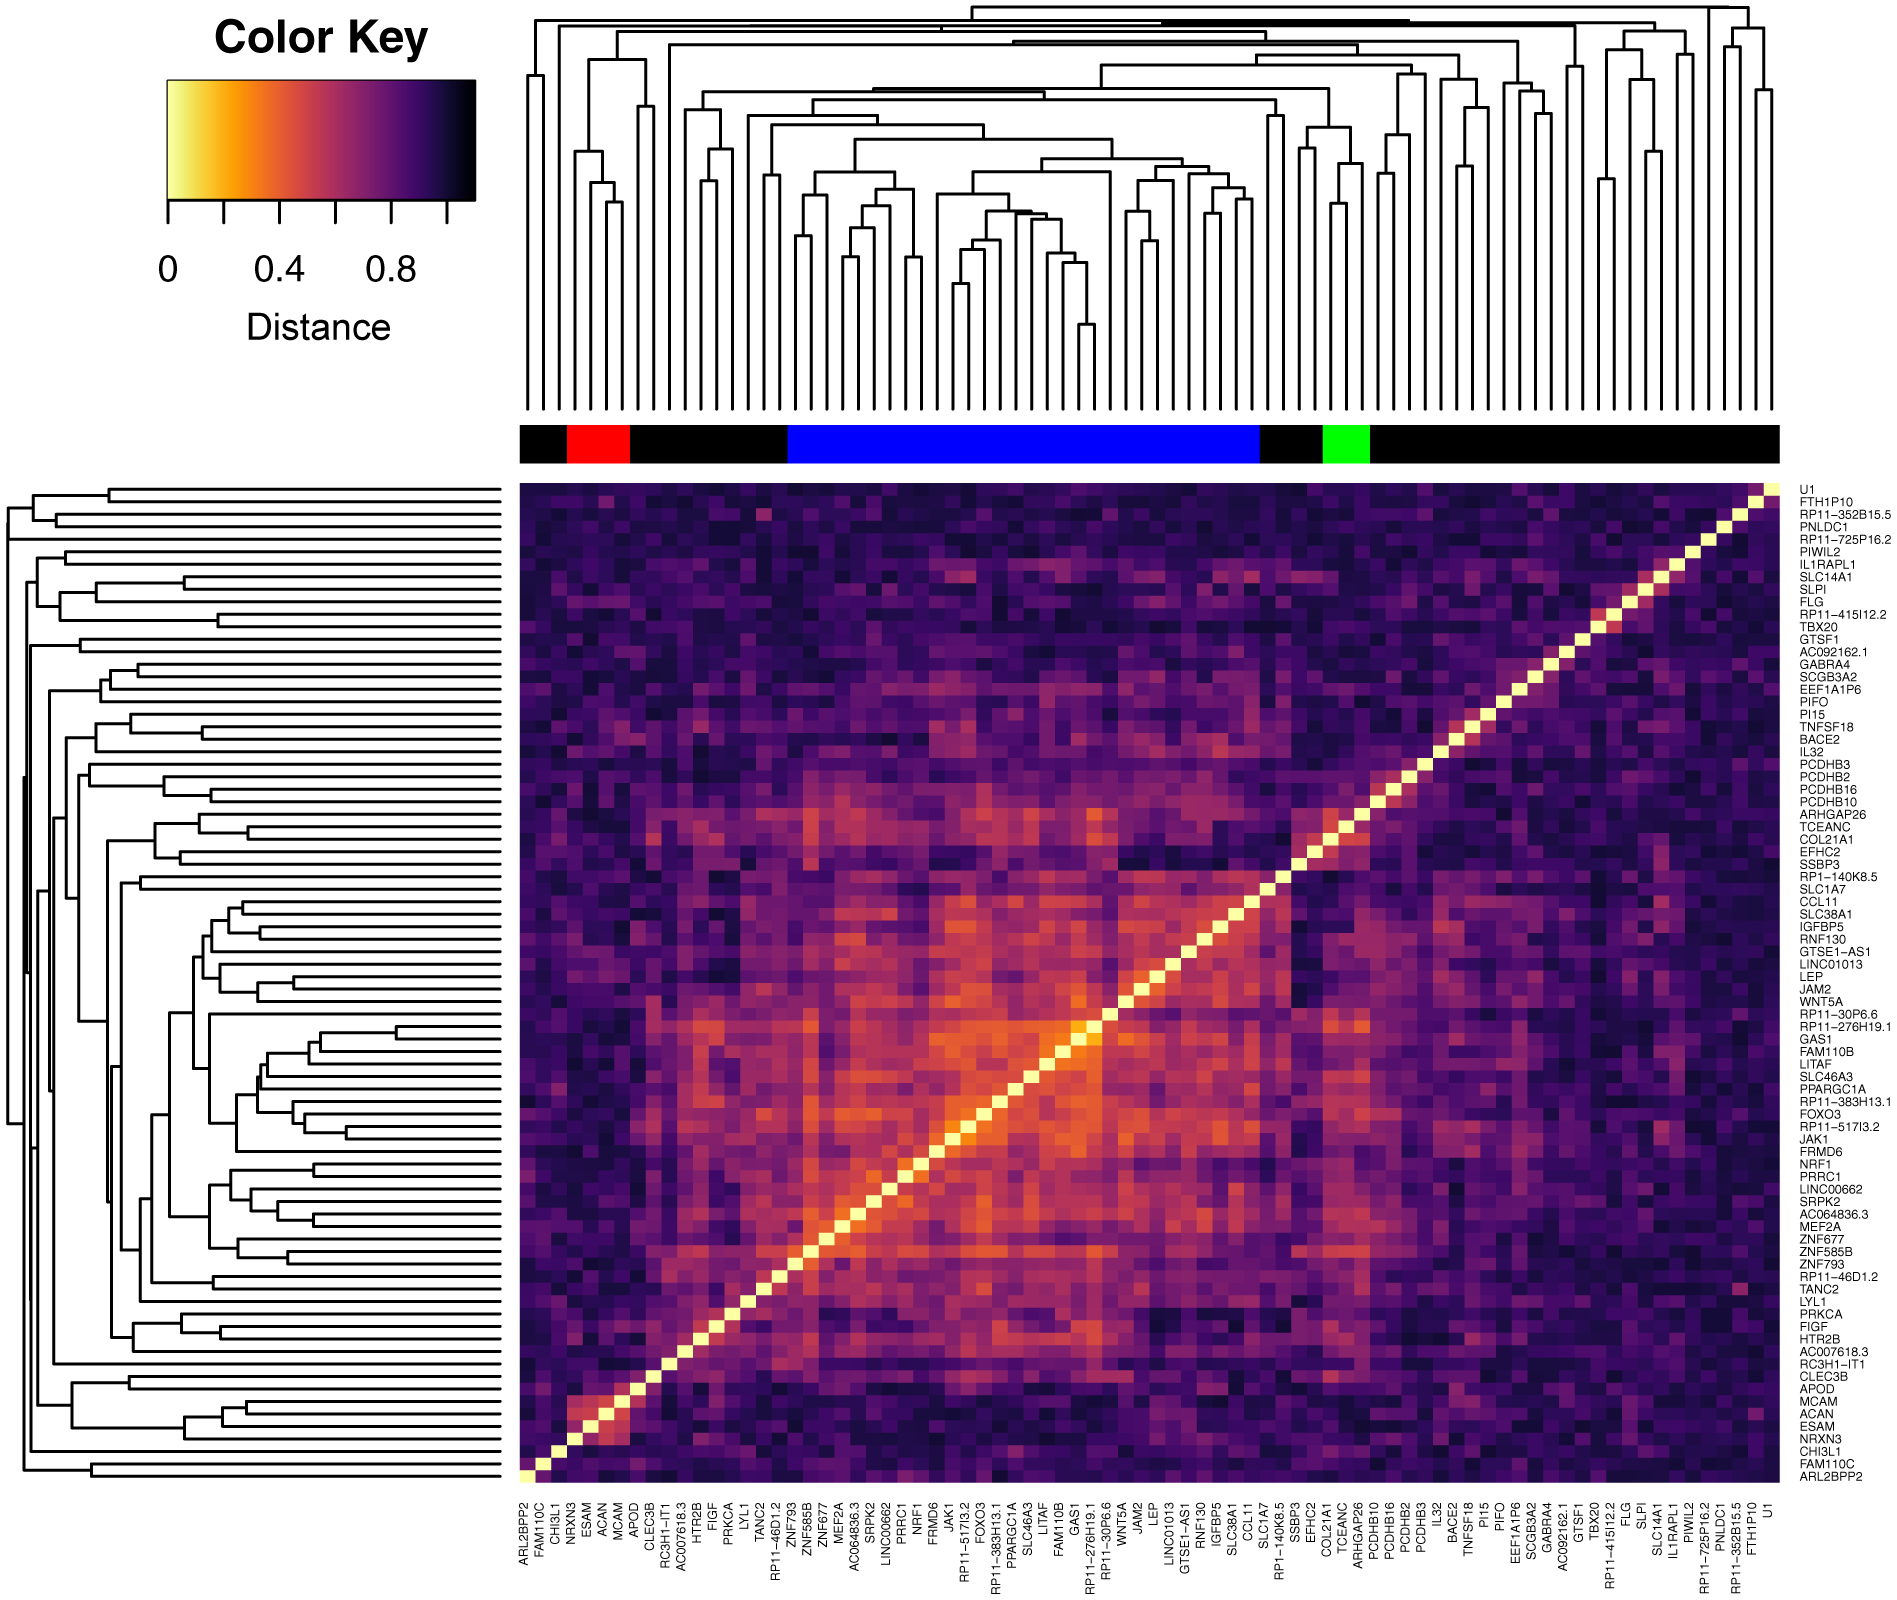
Figure 2. Heatmap and hierarchical clustering of DEX genes.

Clustering was performed using average linkage and a distance of one minus the absolute value of the Pearson correlation coefficient between the two genes. Lighter color indicates higher correlation. Genes were assigned to a group (colors in bar above heatmap) based on a cutoff at clustering distance of 0.6.
