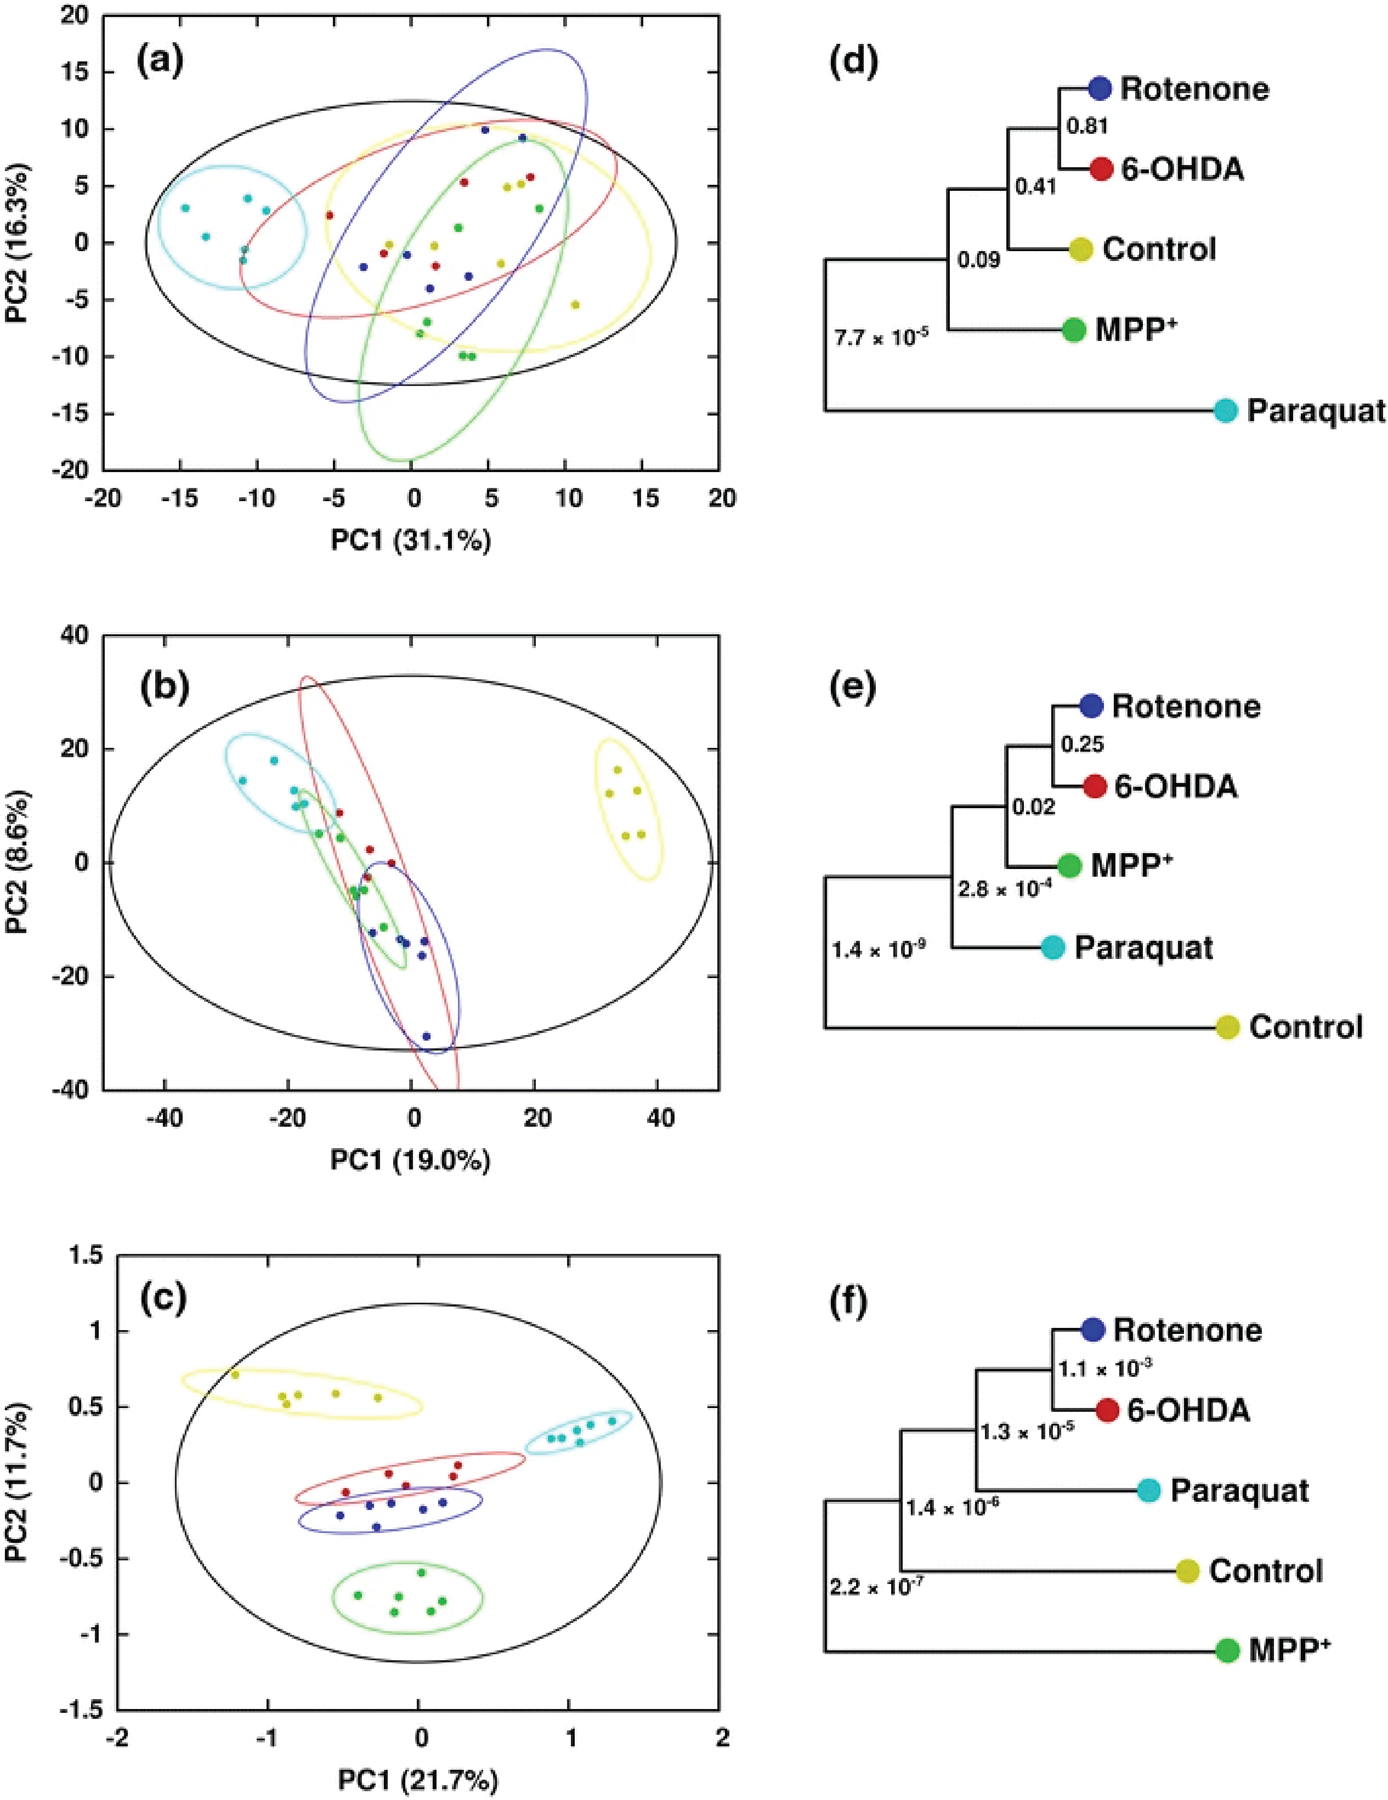
Figure 10.

Scores generated from (a) PCA of 1H NMR in vacuo, (b) PCA of DI-ESI–MS in vacuo, and (c) MB-PCA of 1H NMR and DI-ESI–MS. Separations between classes are greatly increased upon combination of the two data sets via MB-PCA. Symbols designate the following classes: Control (yellow circle), Rotenone (blue circle), 6-OHDA (red circle), MPP+ (green circle), and Paraquat (turquoise colour circle). Corresponding dendrograms are shown in (d–f). The statistical significance of each node in the dendrogram is indicated by a p-value (Worley et al. 2013). Reprinted with permission from Marshall, D.D., Lei, S., Worley, B. et al. Combining DI-ESI–MS and NMR data sets for metabolic profiling. Metabolomics 11, 391–402 (2015). Copyright 2015 Springer Nature.
