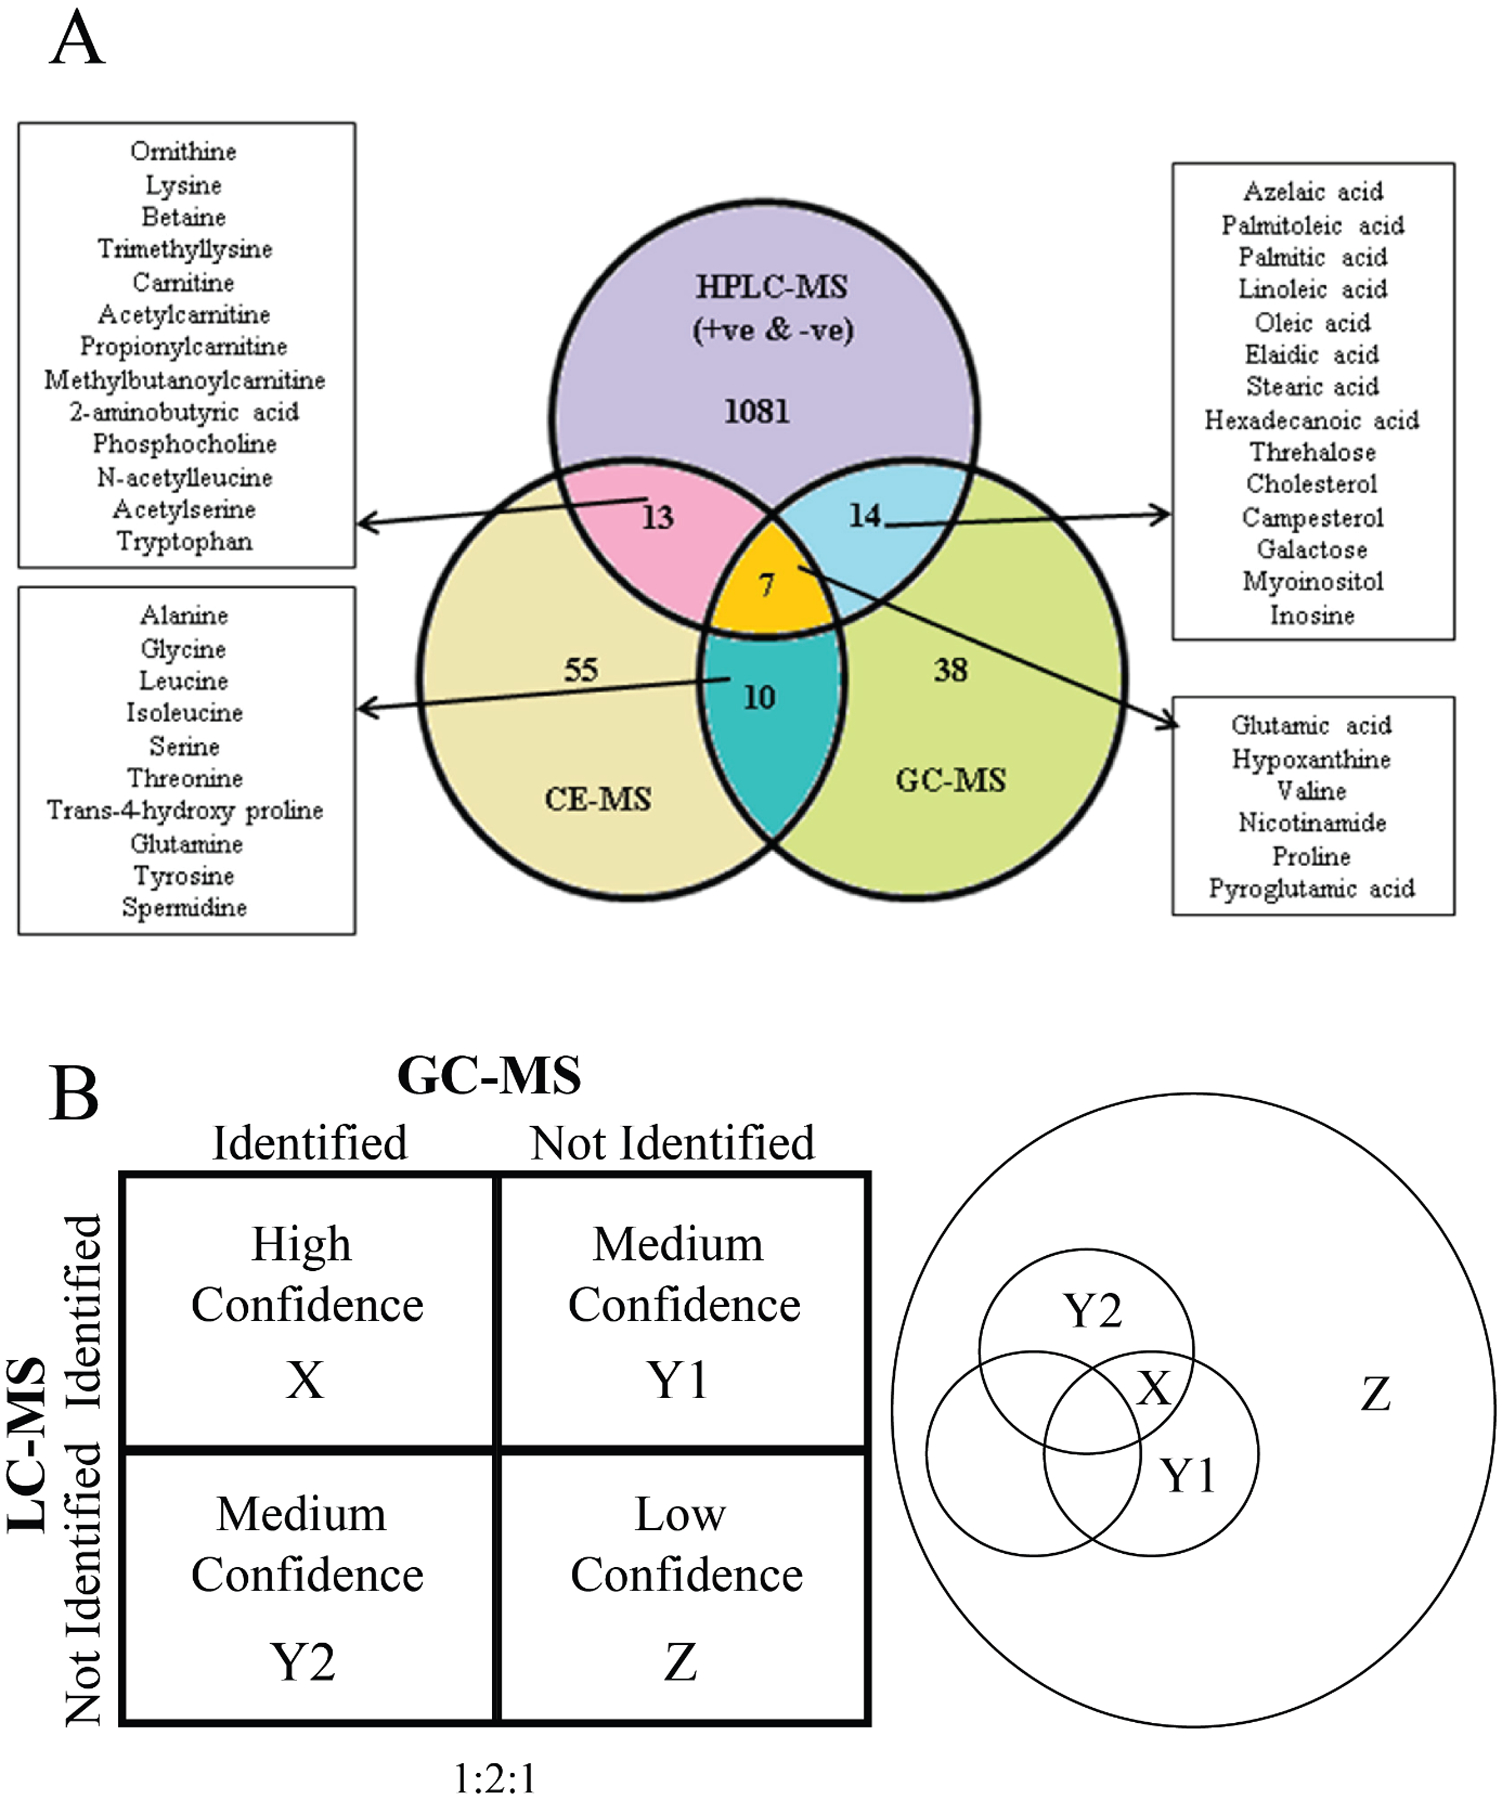
Figure 5.

(A) Venn diagram presenting data for identified features detected in all 6 replicates for mouse lung pool compared between the three analytical platforms (LC–MS, GC/MS, and CE–MS). Reprinted with permission from Naz, S.; García, A.; Barbas, C., Multiplatform Analytical Methodology for Metabolic Fingerprinting of Lung Tissue. Analytical Chemistry 2013, 85 (22), 10941–10948. Copyright 2013 American Chemical Society. (B) (left) Confidence array based on the number of instrumental platforms used to identify a metabolite in a complex biological sample. (right) Venn diagram depicting the group of hypothetical metabolites detected by two (X), one (Y1, Y2), or no (Z) analytical instruments.
