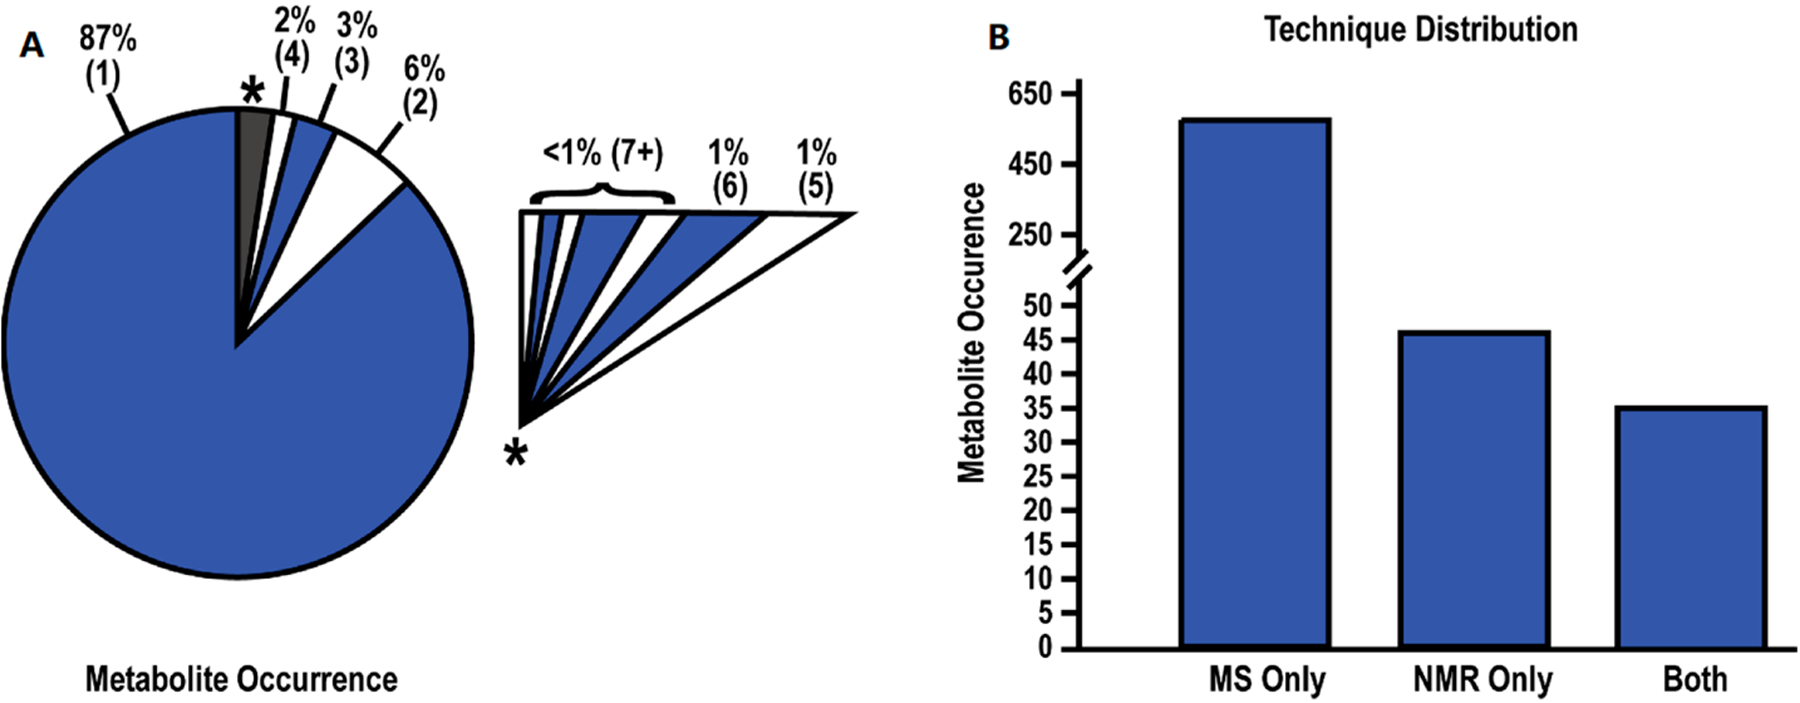
Figure 7.

Summary of Metabolite Data. (A) Pie chart depicting the rate of metabolite occurrence across the 24 studies. Numbers within parentheses indicate the number of studies identifying the metabolites. An expanded view of the grey-starred slice of the pie chart is shown as an insert. (B) Bar chart depicting the number of metabolites identified by MS, NMR, or both techniques. Reprinted with permissions set under the CC BY 4.0 open access license (https://creativecommons.org/licenses/by/4.0/legalcode) from Roth, H.E.; Powers, R. Meta-Analysis Reveals Both the Promises and the Challenges of Clinical Metabolomics. Cancers 2022, 14, 3992. https://doi.org/10.3390/cancers14163992. Copyright 2022 MDPI.
