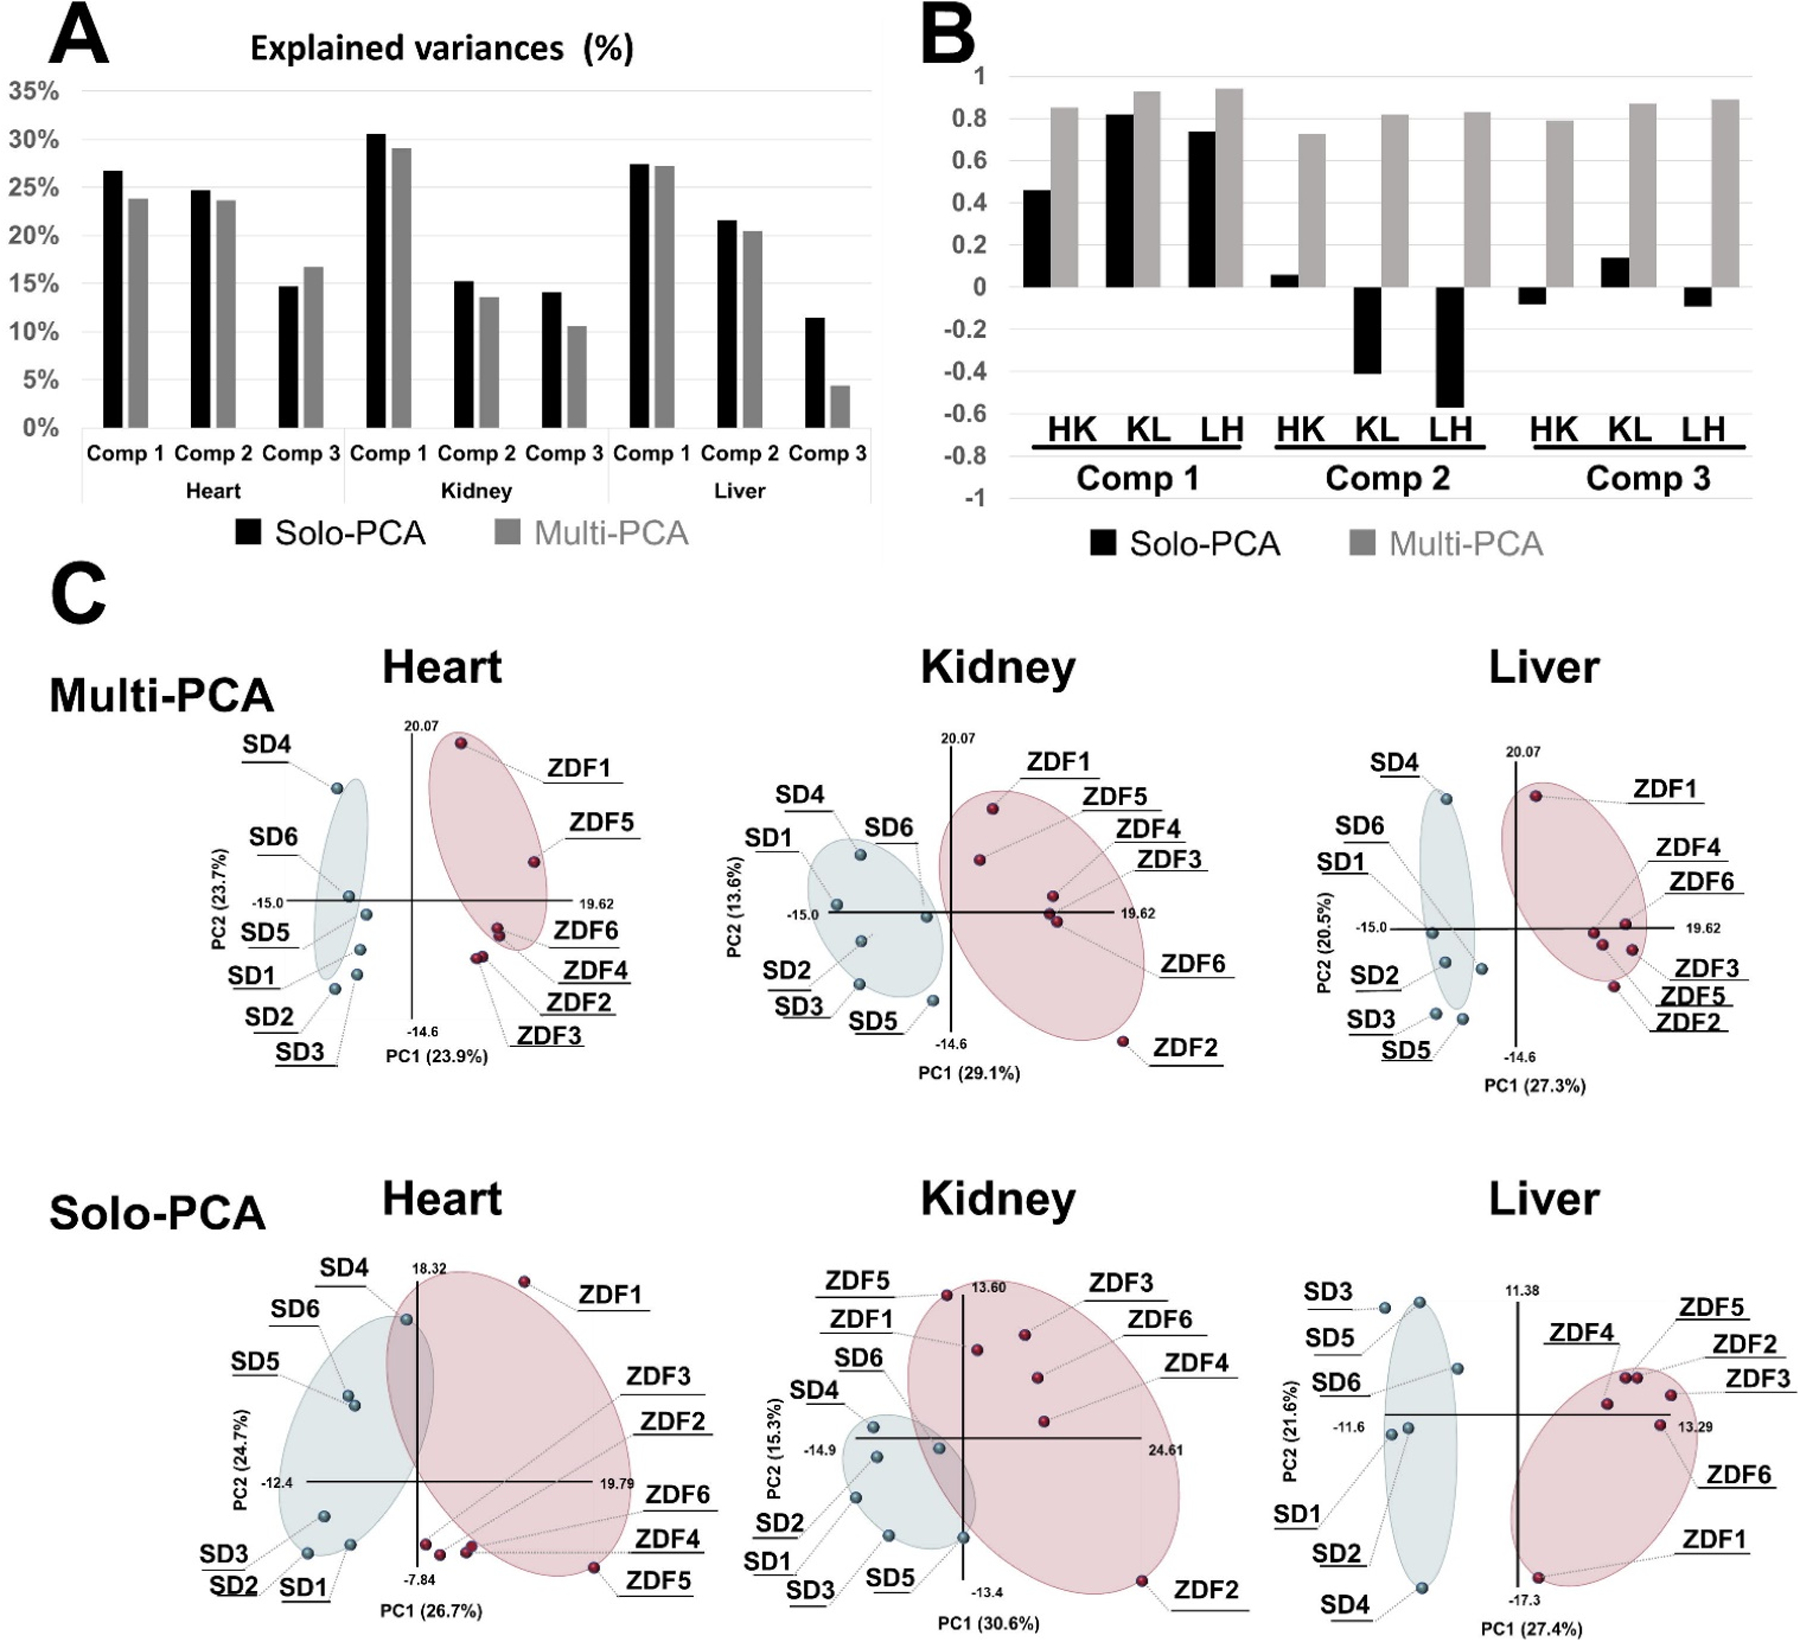
Figure 9.

Comparison of multiblock PCA and solo PCA. Multiblock and solo-PCA were performed with the metabolomic data of the heart, kidney, and liver. (A) The explained variances (%) are indicated by black (solo) and gray (multiblock) bars for the first three components. (B) The cos θ values of the t block scores in the solo and multiblock PCAs are indicated by black and gray bars, respectively. HK: cos θ between heart and kidney, KL: cos θ between kidney and liver, LH: cos θ between liver and heart. (C) The tb block scores of the first and second components are plotted for the multiblock and solo PCAs for the three organs. Six SD rats and six ZDF rats are plotted as light blue and red solid circles in the scatter plots. (For interpretation of the references to colour in this figure legend, the reader is referred to the web version of this article.) Reprinted with permission from K. Tanabe, C. Hayashi, T. Katahira, K. Sasaki, K. Igami, Multiblock metabolomics: An approach to elucidate whole-body metabolism with multiblock principal component analysis. Computational and Structural Biotechnology Journal 2021, 19, 1956–1965. Copyright 2021 Elsevier.
