Figure 3.

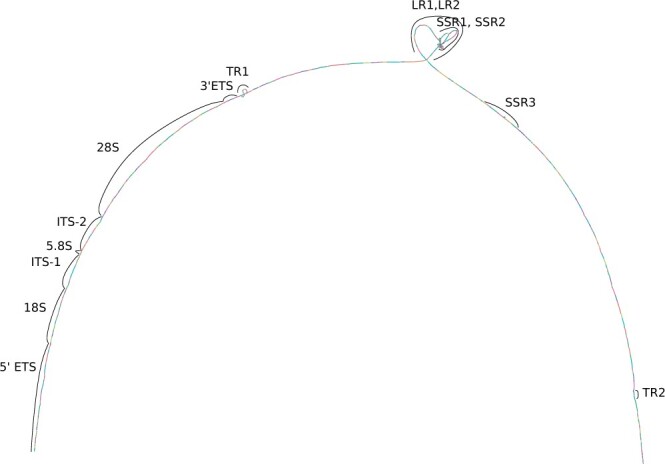
Bandage (Wick et al. 2015) plot of the HG002 morph pangenome with some regions labeled. Supplementary Figure S9 has a larger version.

Bandage (Wick et al. 2015) plot of the HG002 morph pangenome with some regions labeled. Supplementary Figure S9 has a larger version.