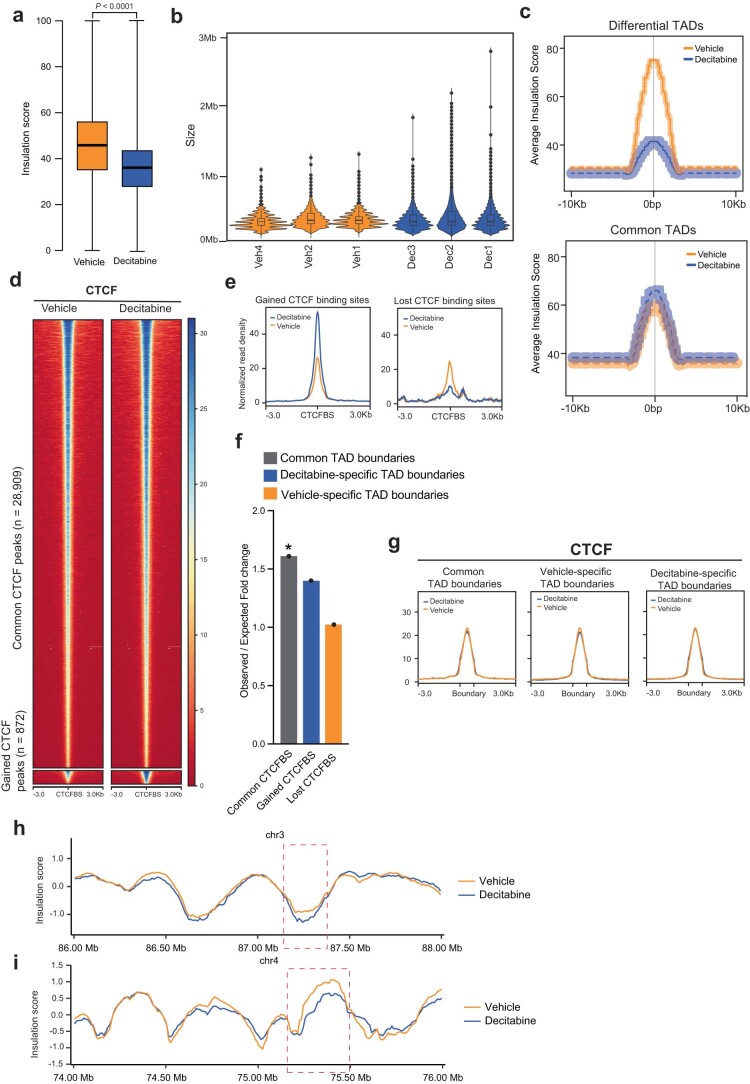
Extended Data Fig. 4. Alteration to TAD structure upon Decitabine treatment.
(a) Average insulation score calculated by TADtool at 50Kb resolution in three biological replicates of Decitabine-treated and Vehicle Gar15-13 PDXs. P value two-sided Wilcox rank sum test. Box plots show median, inter-quartile range and maximum/minimum insulation score. (b) Distribution in TAD sizes for Vehicle and Decitabine treated Gar15-13 PDXs (n = 3 biological replicates each). Box plots show median, inter-quartile range and maximum/minimum log fold change. (c) Average insulation score at differential and common TADs. Lines show mean values, while light shading represents SEM. (d) CTCF CUT&RUN heatmaps at CTCF binding sites gained and lost in Decitabine compared to Vehicle-treated Gar15-13 PDXs. (e) Average signal intensity of CTCF CUT&RUN binding (Gar15-13 Vehicle- and Decitabine-treated PDXs) at gained and lost CTCF binding sites with Decitabine treatment. (f) Observed over expected fold change enrichment of common, gained, and lost CTCF binding sites (CTCFBS) in Decitabine treated Gar15-13 tumours compared to Vehicle across unaltered, Decitabine-specific and Vehicle-specific TAD boundaries. * P value < 0.001 (permutation test). (g) Average signal intensity of CTCF CUT&RUN binding (Gar15-13 Vehicle- and Decitabine-treated tumours) at unaltered, Vehicle-specific and Decitabine-specific TAD boundaries. (h) Snapshot of region on chromosome 3, showing insulation score calculated in Vehicle and Decitabine-treated tumour Hi-C matrixes, demonstrating loss of TAD boundary insulation is Decitabine-treated samples (indicated with a red box). Merged Hi-C data from n = 3 biological replicates shown at 10Kb resolution. (i) Snapshot of region on chromosome 4, showing insulation score calculated in Vehicle and Decitabine-treated tumour Hi-C matrixes, demonstrating loss of TAD boundary insulation is Decitabine-treated samples (indicated with a red box). Merged Hi-C data from n = 3 biological replicates shown at 10Kb resolution.

