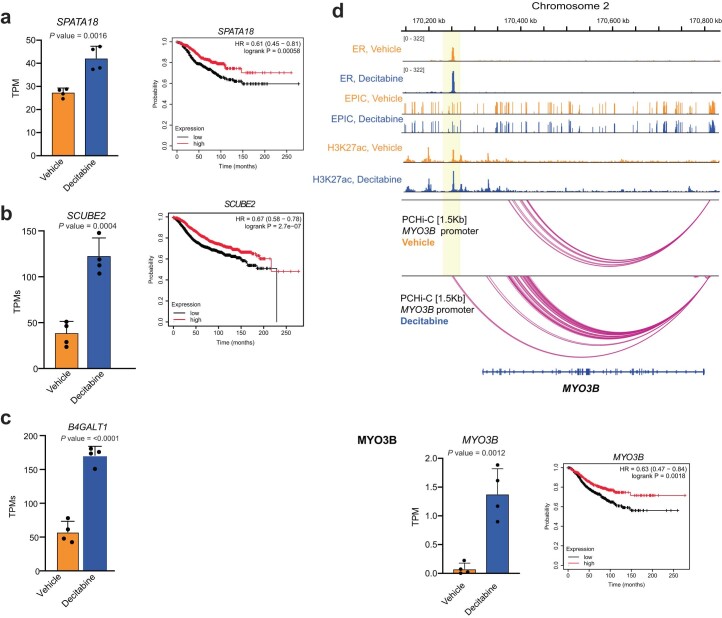
Extended Data Fig. 7. Expression of genes at ER-bound chromatin interactions.
a) The relative mRNA expression levels of SPATA18 gene from RNA-seq (two-tailed t-test P < 0.05 derived from n = 4 biological replicates). Error bars indicate SD from four samples. Kaplan–Meier survival plot showing the ability of SPATA18 gene to stratify ER+ breast cancer patients in the METABRIC cohort into good and poor outcome groups. Data analysed using the log-rank test. P values indicated within the graph. (b) The relative mRNA expression levels of SCUBE2 gene from RNA-seq (two-tailed t-test P < 0.05 derived from n = 4 biological replicates). All data are represented as mean ± SD. Error bars indicate SD from four samples. Kaplan–Meier survival plot showing the ability of SCUBE2 gene to stratify ER+ breast cancer patients in the METABRIC cohort into good and poor outcome groups. Data analysed using the log-rank test. P values indicated within the graph. (c) The relative mRNA expression levels of B4GALT1 gene from RNA-seq (two-tailed t-test P < 0.05 derived from n = 4 biological replicates). All data are represented as mean ± SD. Error bars indicate SD from four samples. (d) Browser snapshots showing the promoter-anchored interactions at the MYO3B ER target gene, together with ER ChIP-seq, EPIC DNA methylation, H3K27ac CUT&RUN signal, ChromHMM track and PCHi-C interaction track. Merged replicate data shown (n = 4 biological replicates each, n = 3 biological replicates for CUT&RUN and PCHi-C). In Decitabine-treated tumours, the MYO3B promoter displays increased number of interactions with an enhancer, which gains ER and H3K27ac binding with Decitabine treatment. The relative expression of the MYO3B gene was significantly upregulated in Decitabine-treated tumours (two-tailed t-test P < 0.05 derived from n = 4 biological replicates) and associated with good outcome in ER+ breast cancer patients in the METABRIC cohort. Data analysed using the log-rank test. P values indicated within the graph. All data are represented as mean ± SD. Error bars indicate SD from four samples.

