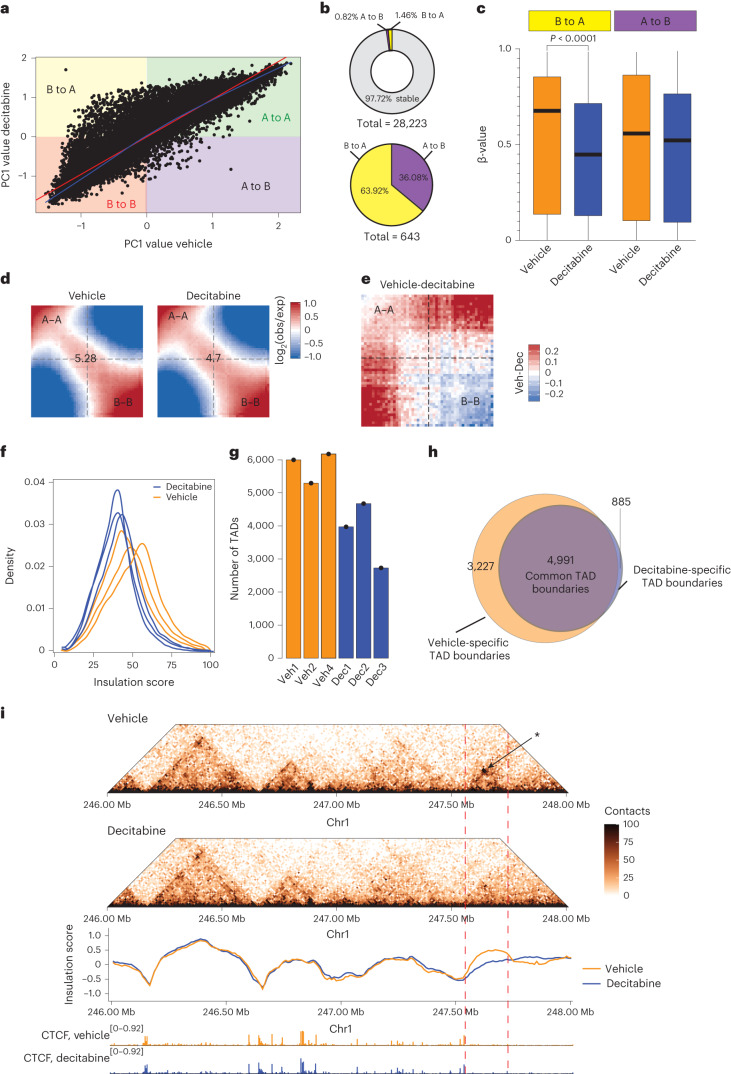
Fig. 2. Loss of DNA methylation results in de-compaction of chromatin.
a, Correlation between average eigenvalues per bin in vehicle-treated and decitabine-treated Gar15-13 PDX tumors. b, Top panel: distribution of stable (A to A; B to B) and switching (A to B; B to A) compartments in decitabine-treated Gar15-13 tumors compared to vehicle-treated tumors. Bottom panel: distribution of different types of switching compartments (A to B; B to A) in decitabine-treated tumors compared to vehicle-treated tumors. c, DNA methylation levels at compartment regions that switched their assignment from B to A and from A to B in decitabine-treated (n = 4 biological replicates) and vehicle-treated (n = 4 biological replicates) PDX tumors. Black line indicates median ± s.d. Box plots show median, interquartile range and maximum–minimum DNA methylation. Data were analyzed using the two-sided Z-test. d, Average contact enrichment (saddle plots) between pairs of 50 kb loci arranged by their PC1 eigenvector in vehicle-treated and decitabine-treated tumors. Average data from n = 3 biological replicates shown. The numbers at the center of the heatmaps indicate compartment strength calculated as the log2 transformed ratio of (A–A + B–B) / (A–B + B–A) using the mean values. e, Saddle plots calculated using the averaged PC1 obtained from vehicle-treated (n = 3 biological replicates) and decitabine-treated (n = 3 biological replicates) tumors. f, Density plot of insulation scores calculated in vehicle-treated and decitabine-treated tumors. g, Number of TADs identified in vehicle-treated and decitabine-treated (n = 3 biological replicates each) PDX tumors. h, Overlap between TAD boundaries identified in vehicle-treated and decitabine-treated tumors. i, Snapshot of region on chromosome 1, showing vehicle-treated and decitabine-treated tumor Hi-C matrixes. Loss of a TAD in decitabine-treated samples is indicated with an arrow, concomitant with decreased insulation at that region. Merged Hi-C data from replicates (n = 3) at 10 kb resolution. Merged CTCF CUT&RUN signal shown below.

