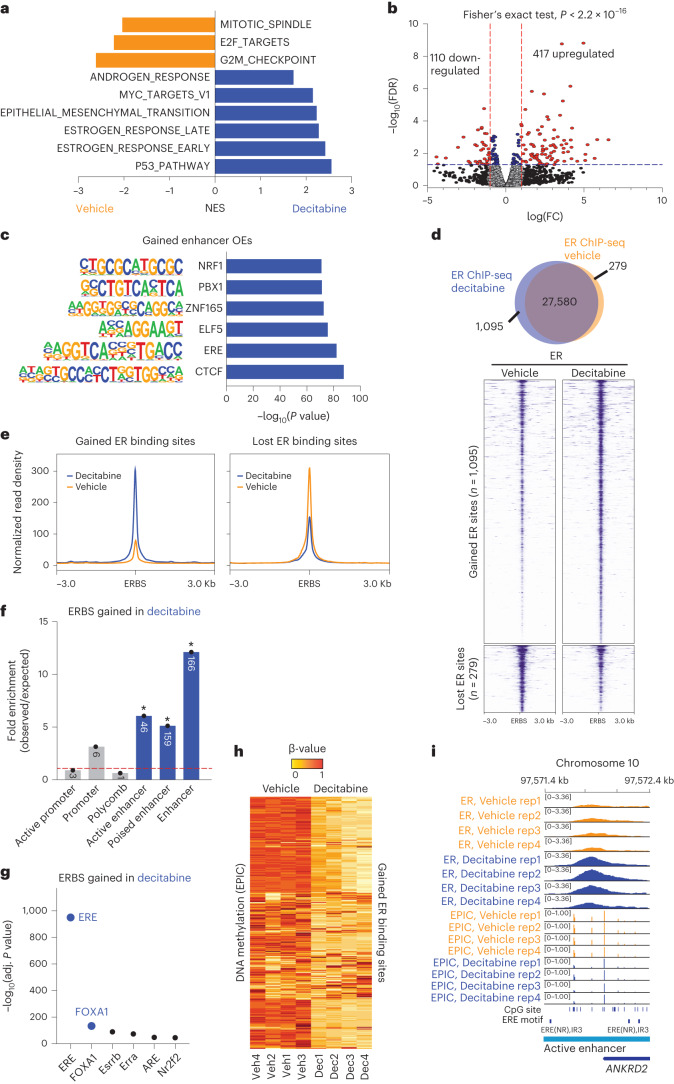
Fig. 4. Rewired 3D chromatin interactions align with altered transcription.
a, Normalized enrichment scores (NES) for signature gene sets representing differentially expressed genes in RNA-seq data from Gar15-13 PDX tumors treated with decitabine compared to vehicle (n = 4 biological replicates; FDR < 0.05). b, Decitabine versus vehicle differential expression of genes that are located at enhancer–promoter interactions gained with decitabine treatment. Data analyzed with two-sided Fisher’s exact test. c, Transcription factor motifs significantly enriched at promoter-interacting enhancers (enhancer OEs) gained with decitabine treatment. Only motifs with binomial P < 0.05 are shown. d, Overlap of consensus ER peaks in vehicle-treated and decitabine-treated Gar15-13 PDX tumors (n = 4 biological replicates each). Heatmaps indicate ER ChIP-seq signal intensity at ERBS gained and lost in decitabine-treated compared to vehicle-treated tumors. e, Average signal intensity of ER ChIP-seq binding (Gar15-13 vehicle-treated and decitabine-treated tumors) at gained and lost ERBS with decitabine treatment. f, ChromHMM (TAMR) annotation (*P < 0.001, permutation test) of ERBS gained with decitabine treatment compared to matched random regions across the genome. Size of the overlap is presented in the respective column. g, Transcription factor motifs enriched at ERBS gained with decitabine treatment compared to matched random regions generated from ERE binding motifs across the genome. h, DNA methylation levels (β-values) at gained ERBS in decitabine-treated and vehicle-treated PDX tumors (n = 4 biological replicates each). i, Browser snapshot of ER ChIP-seq together with EPIC DNA methylation (vehicle and decitabine treatments, n = 4 biological replicates each) showing gain of ER binding and loss of DNA methylation at an enhancer region of ER target gene ANKRD2.

