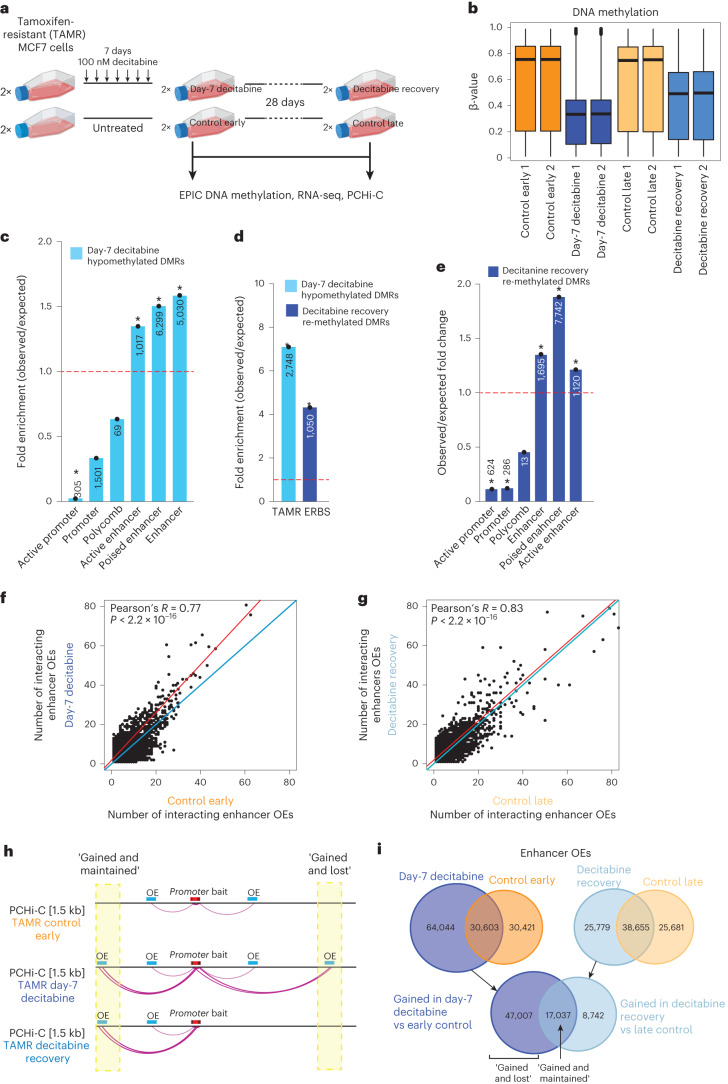
Fig. 6. Dynamics between DNA methylation and 3D chromatin interactions.
a, Experimental design for the TAMR cell line study. Created with Biorender.com. b, Distribution of DNA methylation for control early, control late, day-7 decitabine and decitabine recovery (n = 2 technical replicates each) TAMRs for all EPIC probes. Black line indicates median ± s.d. Box plots show median, interquartile range and maximum–minimum DNA methylation. c, O/E fold change enrichment of DMRs in day-7 decitabine TAMRs compared to control early across TAMR ChromHMM regulatory regions (*P < 0.001, permutation test). The numbers located within each specific region are presented in the respective column. d, O/E fold change enrichment of day-7 decitabine hypomethylated DMRs (compared to control early) and decitabine recovery re-methylated DMRs (compared to day-7 decitabine) for ER binding in TAMRs3 (*P < 0.0001, permutation test). e, O/E fold change enrichment of EPIC DMRs that become re-methylated in decitabine recovery TAMRs compared to day-7 decitabine cells across TAMR ChromHMM regulatory regions (*P < 0.001, permutation test). The numbers located within each specific region are presented in the respective column. f, Number of enhancer OEs per promoter bait for each promoter-anchored interaction in day-7 decitabine and control early TAMRs. Merged data across replicates shown. Data were analyzed by two-tailed Pearson’s correlation test. g, Number of enhancer OEs per promoter bait for each promoter-anchored interaction in decitabine recovery and control late TAMRs. Merged data across replicates shown. Data were analyzed by two-tailed Pearson’s correlation test. h, Schematic representation of two identified classes (gained and lost; gained and maintained) of gained chromatin interactions in TAMRs. i, Overlap of enhancer OEs between day-7 decitabine and control early (left panel) and decitabine recovery and control late TAMRs (right panel). Bottom diagram shows overlap between gained interactions in day-7 decitabine versus control early and in decitabine recovery versus control late, demonstrating the number of gained and lost versus gained and maintained interactions. Merged data across replicates shown.

