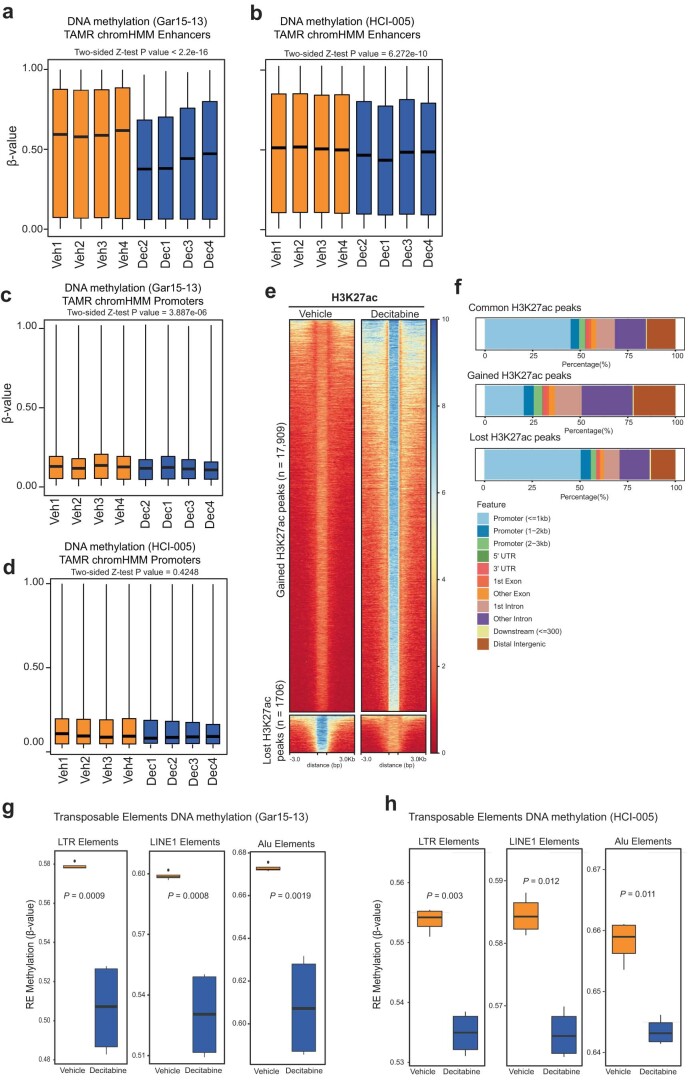
Extended Data Fig. 2. Decitabine induced DNA hypomethylation at regulatory elements.
(a) Distribution of DNA methylation for Vehicle and Decitabine-treated (n = 4 biological replicates each) Gar15-13 PDXs for EPIC probes located at TAMR ChromHMM enhancer regions. Black line indicates median ± SD. Box plots show median, inter-quartile range and maximum/minimum DNA methylation. Data analysed using the two-sided Z test. (b) Distribution of DNA methylation for Vehicle and Decitabine-treated (n = 4 biological replicates each) HCI-005 PDXs for EPIC probes located at TAMR ChromHMM enhancer regions. Black line indicates median ± SD. Box plots show median, inter-quartile range and maximum/minimum DNA methylation. Data analysed using the two-sided Z test. (c) Distribution of DNA methylation for Vehicle and Decitabine-treated (n = 4 biological replicates each) Gar15-13 PDXs for EPIC probes located at TAMR ChromHMM promoter regions. Black line indicates median ± SD. Box plots show median, inter-quartile range and maximum/minimum DNA methylation. Data analysed using the two-sided Z test. (d) Distribution of DNA methylation for Vehicle and Decitabine-treated (n = 4 biological replicates each) HCI-005 for EPIC probes located at TAMR ChromHMM promoter regions. Black line indicates median ± SD. Box plots show median, inter-quartile range and maximum/minimum DNA methylation. Data analysed using the two-sided Z test. (e) H3K27ac CUT&RUN heatmap at H3K27ac binding sites gained and lost in Decitabine compared to Vehicle-treated Gar15-13 PDXs. (f) RefSeq annotation of Vehicle vs. Decitabine common, gained and lost H3K27ac binding sites in Gar15-13. (g) Distribution of DNA methylation for Vehicle and Decitabine-treated (n = 4 biological replicates each) Gar15-13 PDXs for EPIC probes mapping to LTR, LINE1 and Alu elements (REMP annotation). Black line indicates median ± SD. Box plots show median, inter-quartile range and maximum/minimum DNA methylation. Data analysed using the two-sided Z test. (h) Distribution of DNA methylation for Vehicle and Decitabine-treated HCI-005 PDXs for EPIC probes mapping to LTR, LINE1 and Alu elements (REMP annotation) (n = 4 biological replicates each). Black line indicates median ± SD. Box plots show median, inter-quartile range and maximum/minimum DNA methylation. Data analysed using the two-sided Z test.

