Fig. 7.
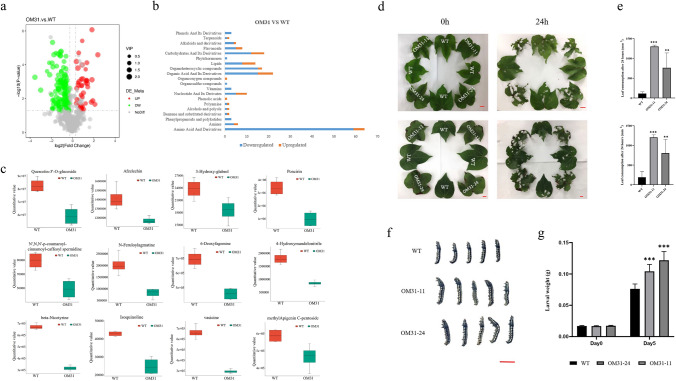
Overexpression of GhMPK31 reduced the accumulation of defensive metabolites and decreased the defense ability of cotton against herbivorous insects. a Volcanic map of differential metabolites between OM31 and WT. Red represents up-regulated metabolites and green represents down-regulated metabolites, (qvalue < 0.05). b Number of differential metabolites in each compound class in OM31 mutants. Orange represents up-regulated metabolites and green represents down-regulated metabolites (qvalue < 0.05). c Box diagram of defense-related metabolites between OM31 and WT. Green for WT, red for OM31. Error bars represent ± standard errors of four replicates. Means ± SE (n = 4). d Choice feeding assay of H. armigera. The third-instar H. armigera were pre-starved for 6 h and photographed at 0 h and 24 h. The red line represents 1 cm. e Leaf consumption in the choice feeding assay for H. armigera. Means ± SE (n = 6). f Comparison between the body-size of larvae fed on WT plants and OM31 lines leaves after 5 days of non-selective feeding. The red line represents 1 cm. g Average larval weight on days 0 and 5. Means ± SE (n = 12). Statistical analyses were performed using Student’s t test. *, p < 0.05; **, p < 0.01. ***; p < 0.001. All of the experiments were repeated at least three times with similar results

