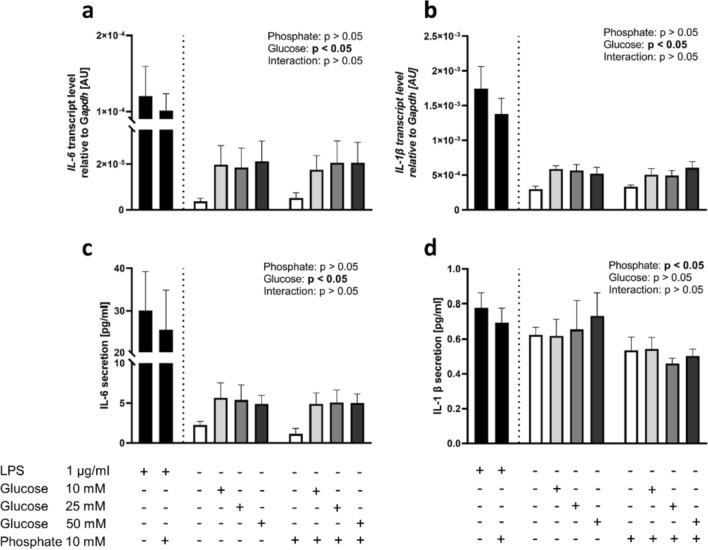
Fig. 4.
Transcript levels of a interleukin-6 (IL-6) and b interleukin-1 β (IL-1β) in U937 cells after 2 h treatment and concentrations of c IL-6 and (d) IL-1β in supernatant after 24 h incubation with medium alone (white bars), with added lipopolysaccharide (LPS) (black bars), and with addition (+) of different glucose concentrations [10 mM, 25 mM, 50 mM] (gray bars), with (+) or without (–) addition of phosphate [10 mM]. The data are presented as the mean ± SEM. The LPS data are shown as a positive control and were not included in statistical analyses

