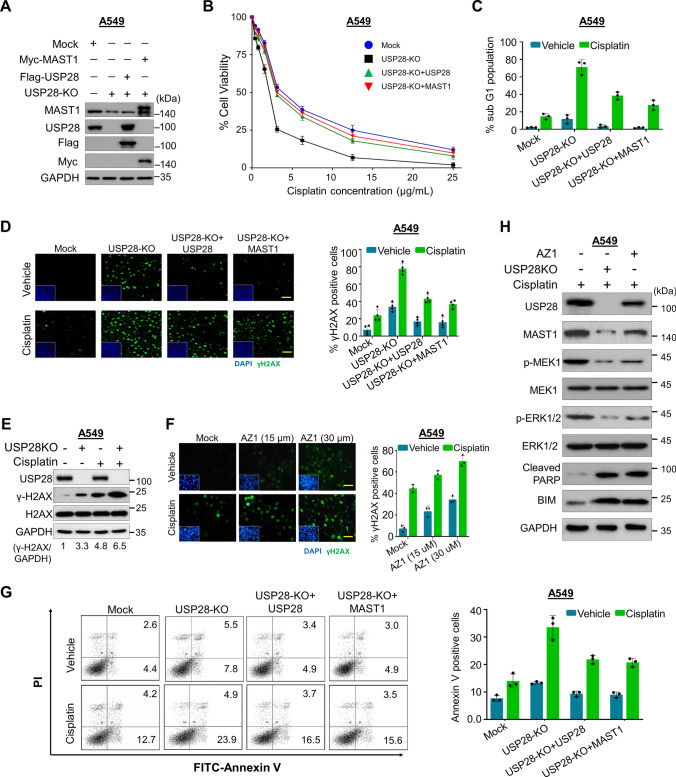
Fig. 5.
Loss of USP28 suppresses cell viability and promotes DNA damage and apoptosis. Mock control, USP28-KO, and USP28-KO cells reconstituted with either USP28 or MAST1 were used to perform the following experiments. A Western blot analysis to validate the expression of USP28 and MAST1 using USP28- and MAST1-specific antibodies in A549 cells. The cells from A were subjected to the following experiments. B A549 cells were treated with an increasing concentration of cisplatin (5 µg/mL, 10 µg/mL, 15 µg/mL, 20 µg/mL and 25 µg/mL) for 48 h, and cell viability was assayed using CCK-8 reagent. Data are presented as the mean and standard deviation of three independent experiments (n = 3). The IC50 values of cisplatin in A549 mock, USP28-KO, and USP28-KO reconstituted with USP28 and USP28-KO reconstituted with MAST1 were 3.56 µg/mL, 2.13 µg/mL, 3.36 µg/mL, and 3.44 µg/mL, respectively. C A549 cells were treated with cisplatin (2 µg/mL) for 48 h and subjected to flow cytometry to measure the DNA content using PI staining and Data are presented as the mean and standard deviation of three independent experiments (n = 3). D A549 cells were treated with either vehicle or Cisplatin (2 µg/mL) for 48 h and subjected to immunofluorescence analysis to estimate γH2AX foci formation. Green, γH2AX; blue, nucleus stained by DAPI. Scale bar = 100 µm. The right panel depicts the percentage of γH2AX-positive cells. Data are presented as the mean and standard deviation of three independent experiments (n = 3). E A549 cells treated with cisplatin (2 µg/mL) for 48 h were subjected to immunoblotting analysis with the indicated antibodies. The protein band intensities were estimated using ImageJ software with reference to the GAPDH control (γ-H2AX/GAPDH) and presented below the blot. F A549 cells were treated with the indicated concentrations of USP28 inhibitor (AZ1) with either vehicle or cisplatin (2 µg/mL) for 48 h and subjected to immunofluorescence analysis to estimate γH2AX foci formation. Green, γH2AX; blue, nucleus stained by DAPI. Scale bar = 100 µm. The right panel depicts the percentage of γH2AX-positive cells. Data are presented as the mean and standard deviation of three independent experiments (n = 3). G A549 cells were treated with cisplatin (2 µg/mL) for 48 h. Flow cytometry analysis was performed to analyze annexin-V and PI positive cells and graphically represented. Data are presented as the means and standard deviations of 3 independent experiments. H The effect of USP28 depletion or USP28 inhibitor (AZ1) on MEK pathway in A549 cells treated with cisplatin (2 µg/mL) by western blotting with indicated antibodies. GAPDH was used as the internal loading control

