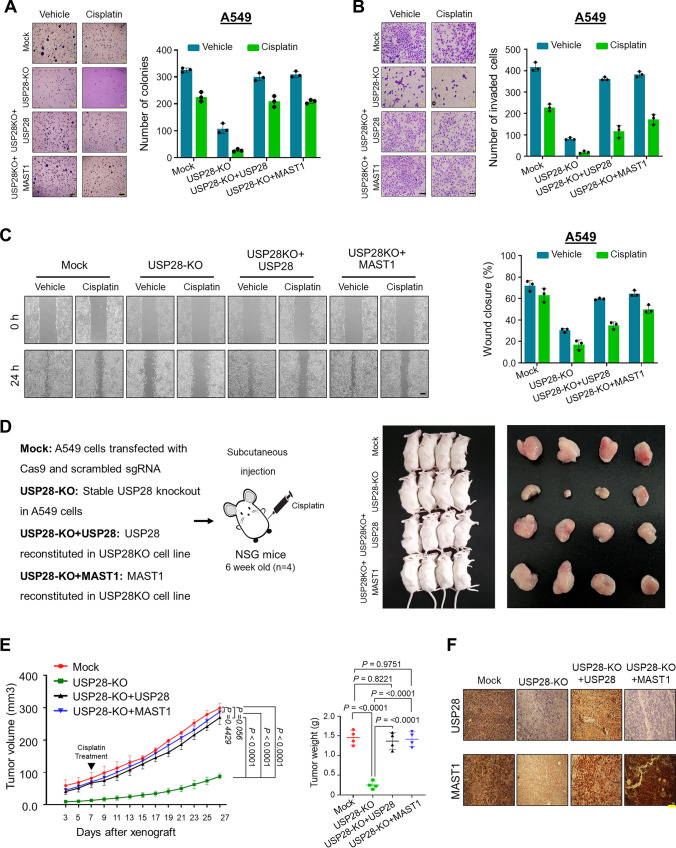
Fig. 6.
Loss of US28 inhibits tumorigenesis in vitro and in vivo. Mock control, USP28-KO, and USP28-KO cells reconstituted with either USP28 or MAST1 were used to perform the following experiments. The cells from (5A) were treated with either vehicle or cisplatin and were subjected to the following experiments. A Colony formation was measured after 14 days in A549 cells. The colony numbers were quantified and are presented graphically. Scale bar, 500 µm. B The transwell cell invasion assay was performed with the groups mentioned in A549 cells. The number of invaded cells were quantified using ImageJ software and represented graphically. Data are presented as the means and standard deviations of 3 independent experiments. Scale bar, 100 µm. C The migration potential of above mentioned groups was assessed by an in vitro scratch assay in A549 cells. The migration potential was quantified by ImageJ software and are presented graphically. Scale bar, 200 µm. Data are presented as the means and standard deviations of 3 independent experiments. D Xenografts were generated by subcutaneously injecting the mentioned cell groups into the right flanks of NSG mice (n = 4/group). Mice were i.p. injected with either saline (vehicle) or cisplatin (2 mg/kg) twice a week beginning 7 days after xenograft implantation, and tumor size was monitored. Tumor volumes were recorded, and tissues were stored for IHC experiments. The right panel shows the tumors excised from the mice after the experiment. E Tumor volume and tumor weight were measured and are presented graphically. Data are presented as the mean and standard deviation (n = 4 mice per group). Statistical power is 80% and was calculated post experiment using G*Power software. Two-way ANOVA followed by Tukey's post-hoc test was used, and the exact P values are indicated on the figures (P < 0.05, P < 0.01, P < 0.001, P < 0.0001 were considered as significant, and P > 0.05 considered as non-significant). F Xenograft tumors were embedded in paraffin and sectioned. IHC analyses were performed with the indicated antibodies. Scale bar = 30 µm

