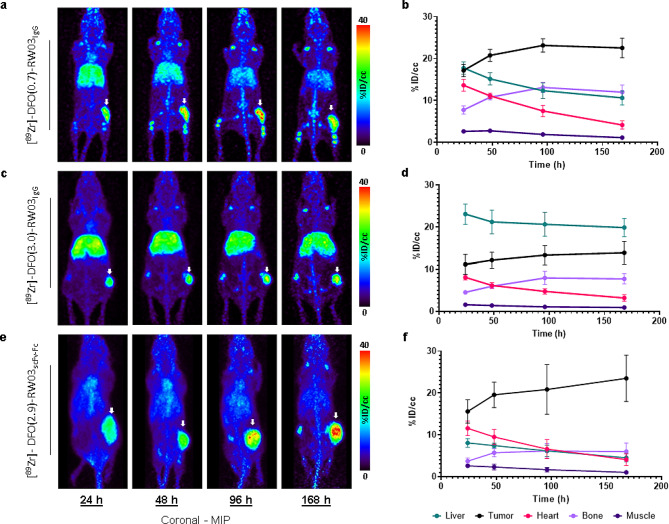
Fig. 2.
In vivo PET images (a,c,e) and corresponding ROI analysis (b, d, f) of [89Zr]-RW03 based radioligands: (a & b) [89Zr]-DFO(0.7)-RW03IgG (1.27 ± 0.03 MBq, 10 ± 0.2 ug), (c & d) [89Zr]-DFO(3.0)-RW03IgG (5.2 ± 0.4 MBq, 27 ± 2 µg), (e & f) [89Zr]-DFO(2.9)-RW03scFv − Fc (1.2 ± 0.1 MBq, 16 ± 2 µg) in HT-29 xenograft BALB/c nu/nu mice. For PET images (a, c, e), the coronal plane is presented as a maximum intensity projection (MIP). White arrow = tumor. For ROI analysis (b, d, f) uptake is expressed as mean radioactivity per mL tissue volume (%ID/cc) ± SEM

