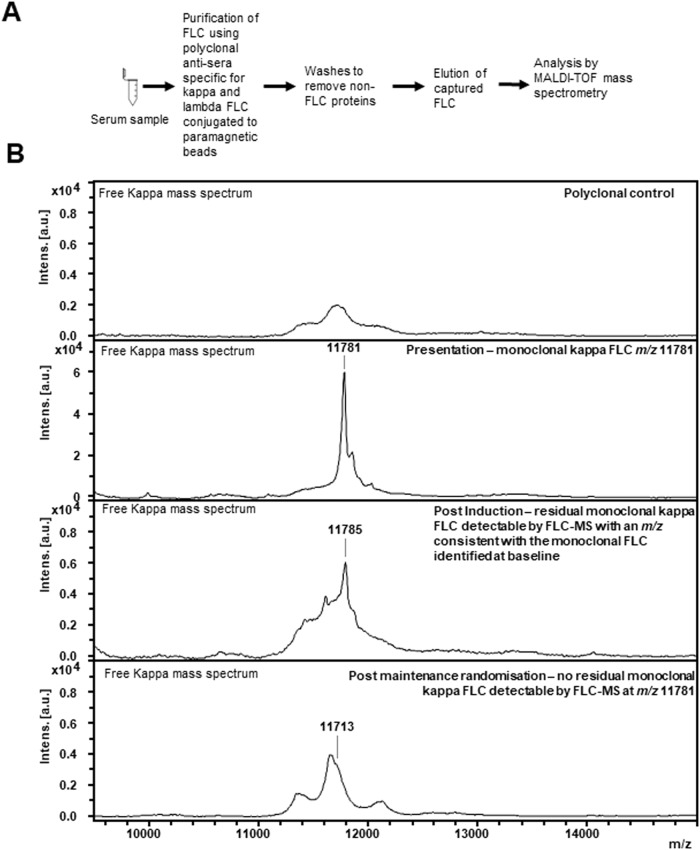
Fig. 2. Workflow and example mass spectra showing how FLC-MS is used to identify and track monoclonal FLC across serial samples.
The workflow for analysis of a serum sample by FLC-MS is shown in (A). B shows example mass spectra of how FLC-MS is used to track monoclonal FLC across serial samples. An example mass spectrum from a polyclonal sample run against free kappa is shown in the top mass spectrum. At presentation monoclonal kappa FLC with an m/z of 11781 for the doubly charged light chain were identified. Persistent residual monoclonal kappa FLC are detectable by FLC-MS (peak at m/z 11785 for the doubly charged light chain) at the end of induction chemotherapy. There is also an oligoclonal peak within the postinduction spectrum with a completely distinct m/z to the monoclonal light chain. At the postmaintenance time point there are no residual monoclonal kappa FLC detectable by FLC-MS. There is a very small abnormality in the kappa FLC spectrum (m/z 11713 for the doubly charged light chain) which is likely due to a very small oligoclonal peak.

