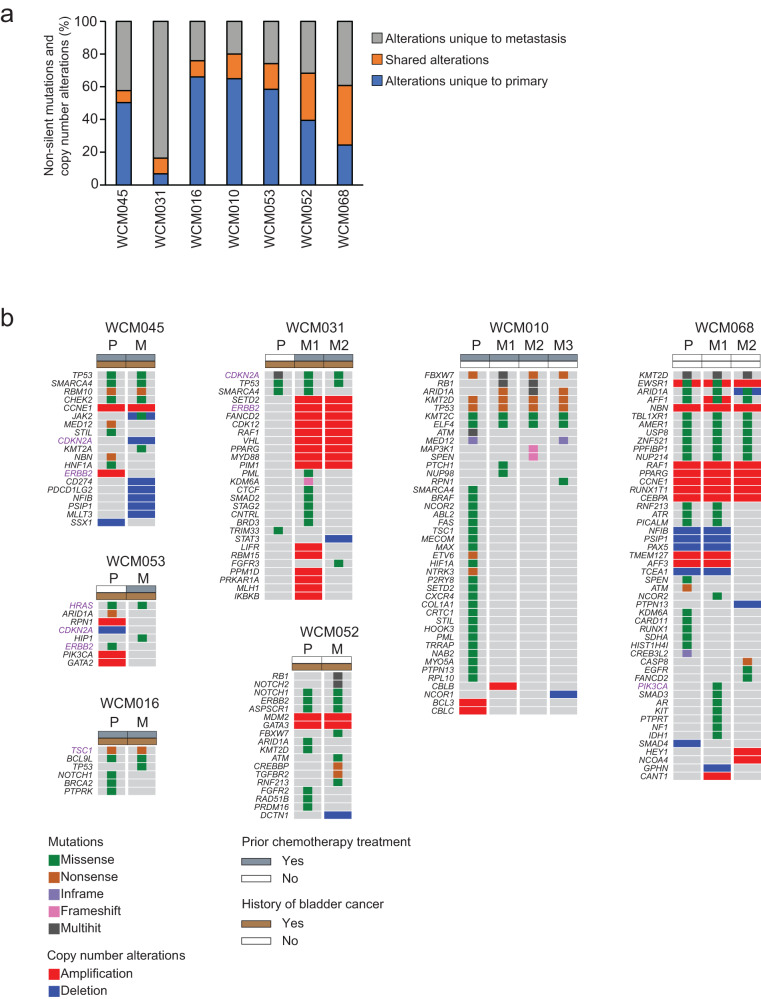
Fig. 3. Genomic heterogeneity between paired primary and metastatic UTUC.
a Percentages of somatic mutations unique to primary (blue) and metastasis (gray) or shared between the matched tumors (orange). b Oncoprints representing somatic mutations and copy number alterations of cancer genes in primary (P) and matched metastatic (M) UTUC. Oncoprints are grouped per case. Chemotherapy treatment prior to tissue collection and a history of bladder cancer are shown on the top of each oncoprint. Alterations shown in purple indicate actionable alterations. Source data are provided as a Source Data file.

