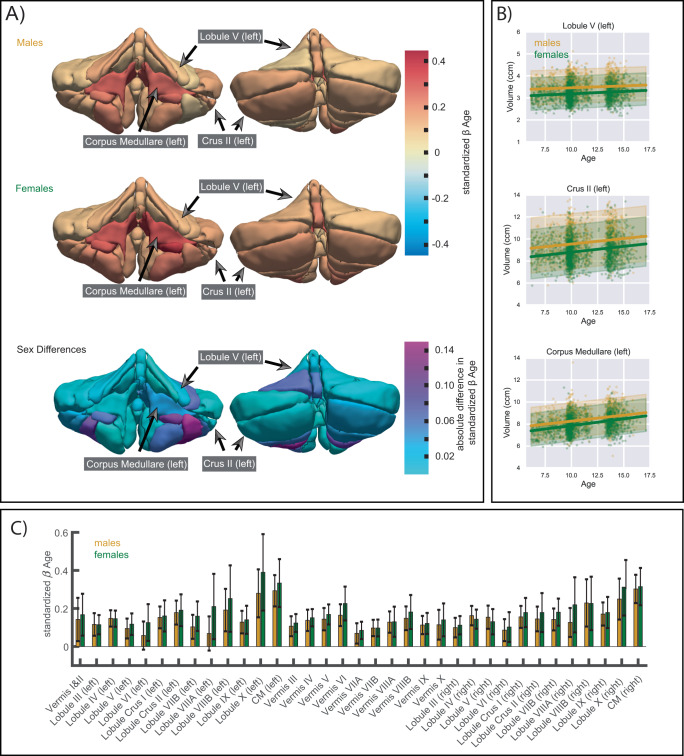
Fig. 2. Effect of age on volume in the anatomical parcellation.
A Mean posterior distribution for the standardized age β coefficient (slope) for each anatomical ROI and absolute differences in effect sizes (standardized β) between males and females are illustrated. 3D illustrations were generated based on a publically available, manually segmented MR image (MAGeT atlas, brain5)7. B Trajectories of males (in yellow) and females (in green) in 3 example ROIs: left Lobule V (anterior cerebellum), left Crus II (posterior cerebellum), and left corpus medullare (white matter tract). The bold lines represent the mean trajectories, shaded areas represent what is within 2 standard deviations of the mean. Volume is shown in cubic centimeters (ccm). C Bar graphs of all standardized age β coefficients (slopes) of males (in yellow) and females (in green). Error bars depict +/− 1 standard deviation of standardized age β samples (n = 12,000). Exact numbers can be found in Supplementary Table 3 and the percentage change of mean trajectories for each anatomical ROI is illustrated in Supplementary Fig. 6A. Source data are provided as a Source Data file.

