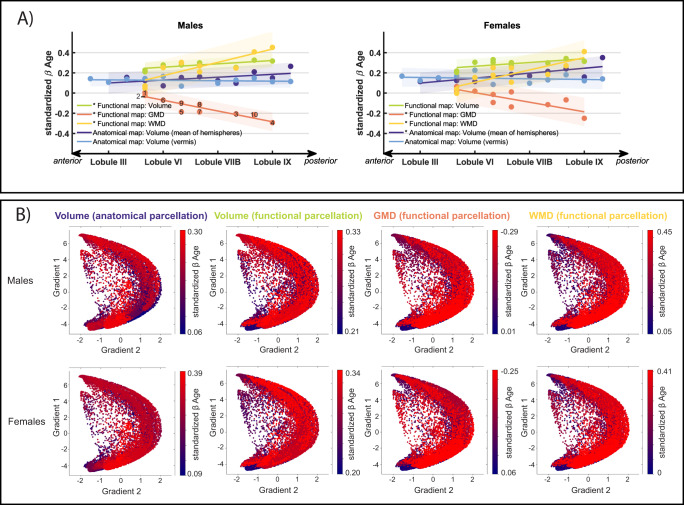
Fig. 5. Visualizations of growth gradients.
A Linear fit lines through the standardized age β coefficients (shown as dots) of anatomical (vermal in light blue and mean of both hemispheres in dark blue) and functional (volume in green, Grey Matter Density (GMD) in orange, and White Matter Density (WMD) in yellow) ROIs in anterior-to-posterior order. Shaded areas indicate the 95% prediction intervals of the linear fit lines. Asterisks in the legend indicate significant AP growth coefficients (slopes of linear fit lines). Anatomical location of functional parcellation centroids are indicated by numbers in the first panel and listed in Supplementary Table 5. B Growth gradients visualized along two functional gradients using the LittleBrain tool23. Gradient 1 (y-axis) ranges from motor (negative values) to non-motor areas (positive values); Gradient 2 (x-axis) from low (negative values) to high (positive values) task focus/cognitive load. Each dot in the scatterplot represents a voxel in the cerebellum. The color map (scaled per modality to ease comparisons) shows standardized age β coefficients of the cerebellar parcellation a given voxel belongs to. Source data are provided as a Source Data file.

