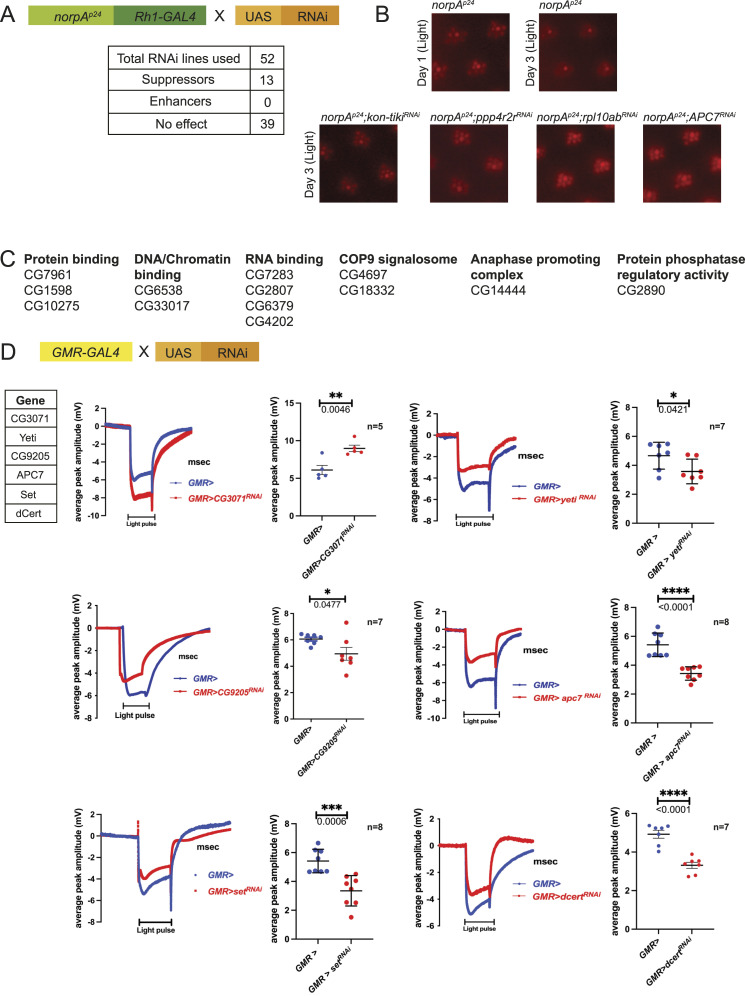
Figure 3. Genetic screen using norpAp24.
(A) Scheme used to test for genetic interaction of each of the 52 su(rdgB) with norpAp24 under illumination conditions (constant light 2000 Lux). (B) norpAp24 flies degenerate by day 3 under light conditions, and examples of su(RDGB) candidates that suppressed the norpAp24 retinal degeneration phenotype. n = 5 flies/RNAi line. (C) Complete list of 13 genes with their cellular functions that suppressed the norpAp24 phenotype. ERG screen. (D) Of 52 candidates, five su(RDGB) showed reduced (CG9205, Yeti, Apc7, Set, and dCert) and one (CG3071) showed higher ERG phenotype (traces and quantification shown) when down-regulated in an otherwise WT background. The number of flies used for the experimental set is mentioned along with the quantification. Scatter plots with the mean ± SEM are shown. Statistical tests: unpaired t test.

