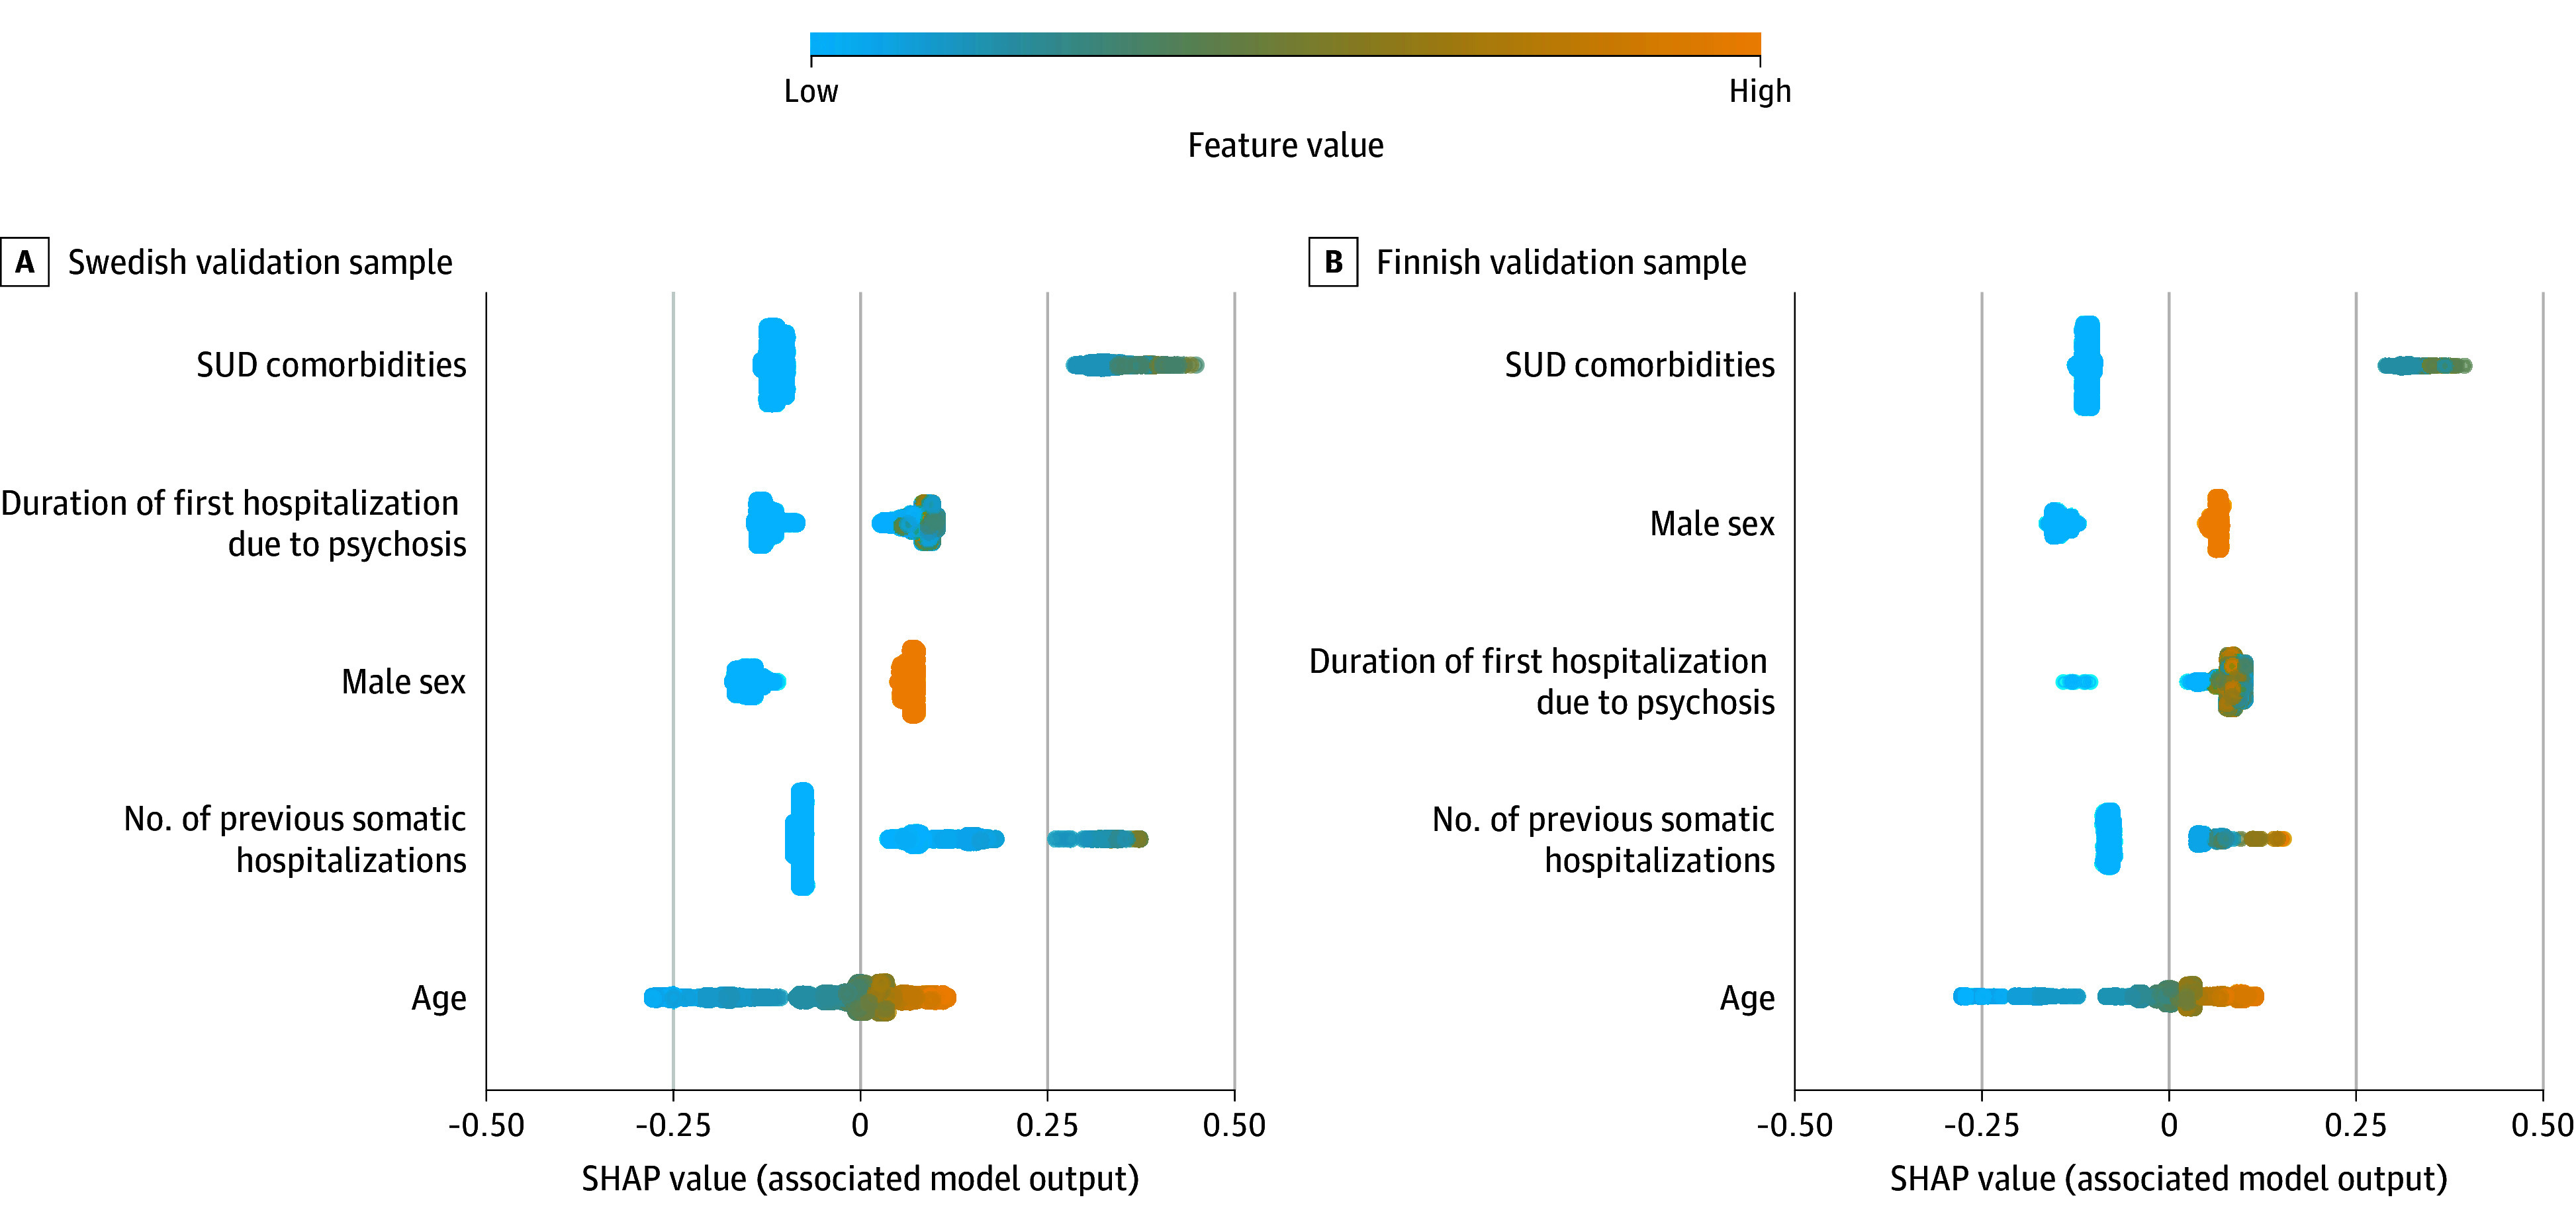
Figure 2. Final Model Shapley Additive Explanation (SHAP) Value Contributions.

Swedish (A) and Finnish (B) validation samples. For each of the 5 variables (features), the SHAP values for each patient with first-episode psychosis (FEP) are displayed horizontally, with color coding indicating the magnitude of these values. The variables are ranked by their mean absolute SHAP value (ranked from the most important to the least from top to bottom). Each point on the chart represents a patient with FEP for a specific variable. The x-axis indicates whether the variable was positively or negatively associated with the model’s prediction of mortality. The color scheme illustrates the variable’s value, adjusted according to the range observed in the dataset (ie, high values in warm colors and low values in cool colors). For example, being male is assigned a high value by this variable, which is positively associated with the model’s prediction of higher mortality risk. SUD indicates substance use disorder.
