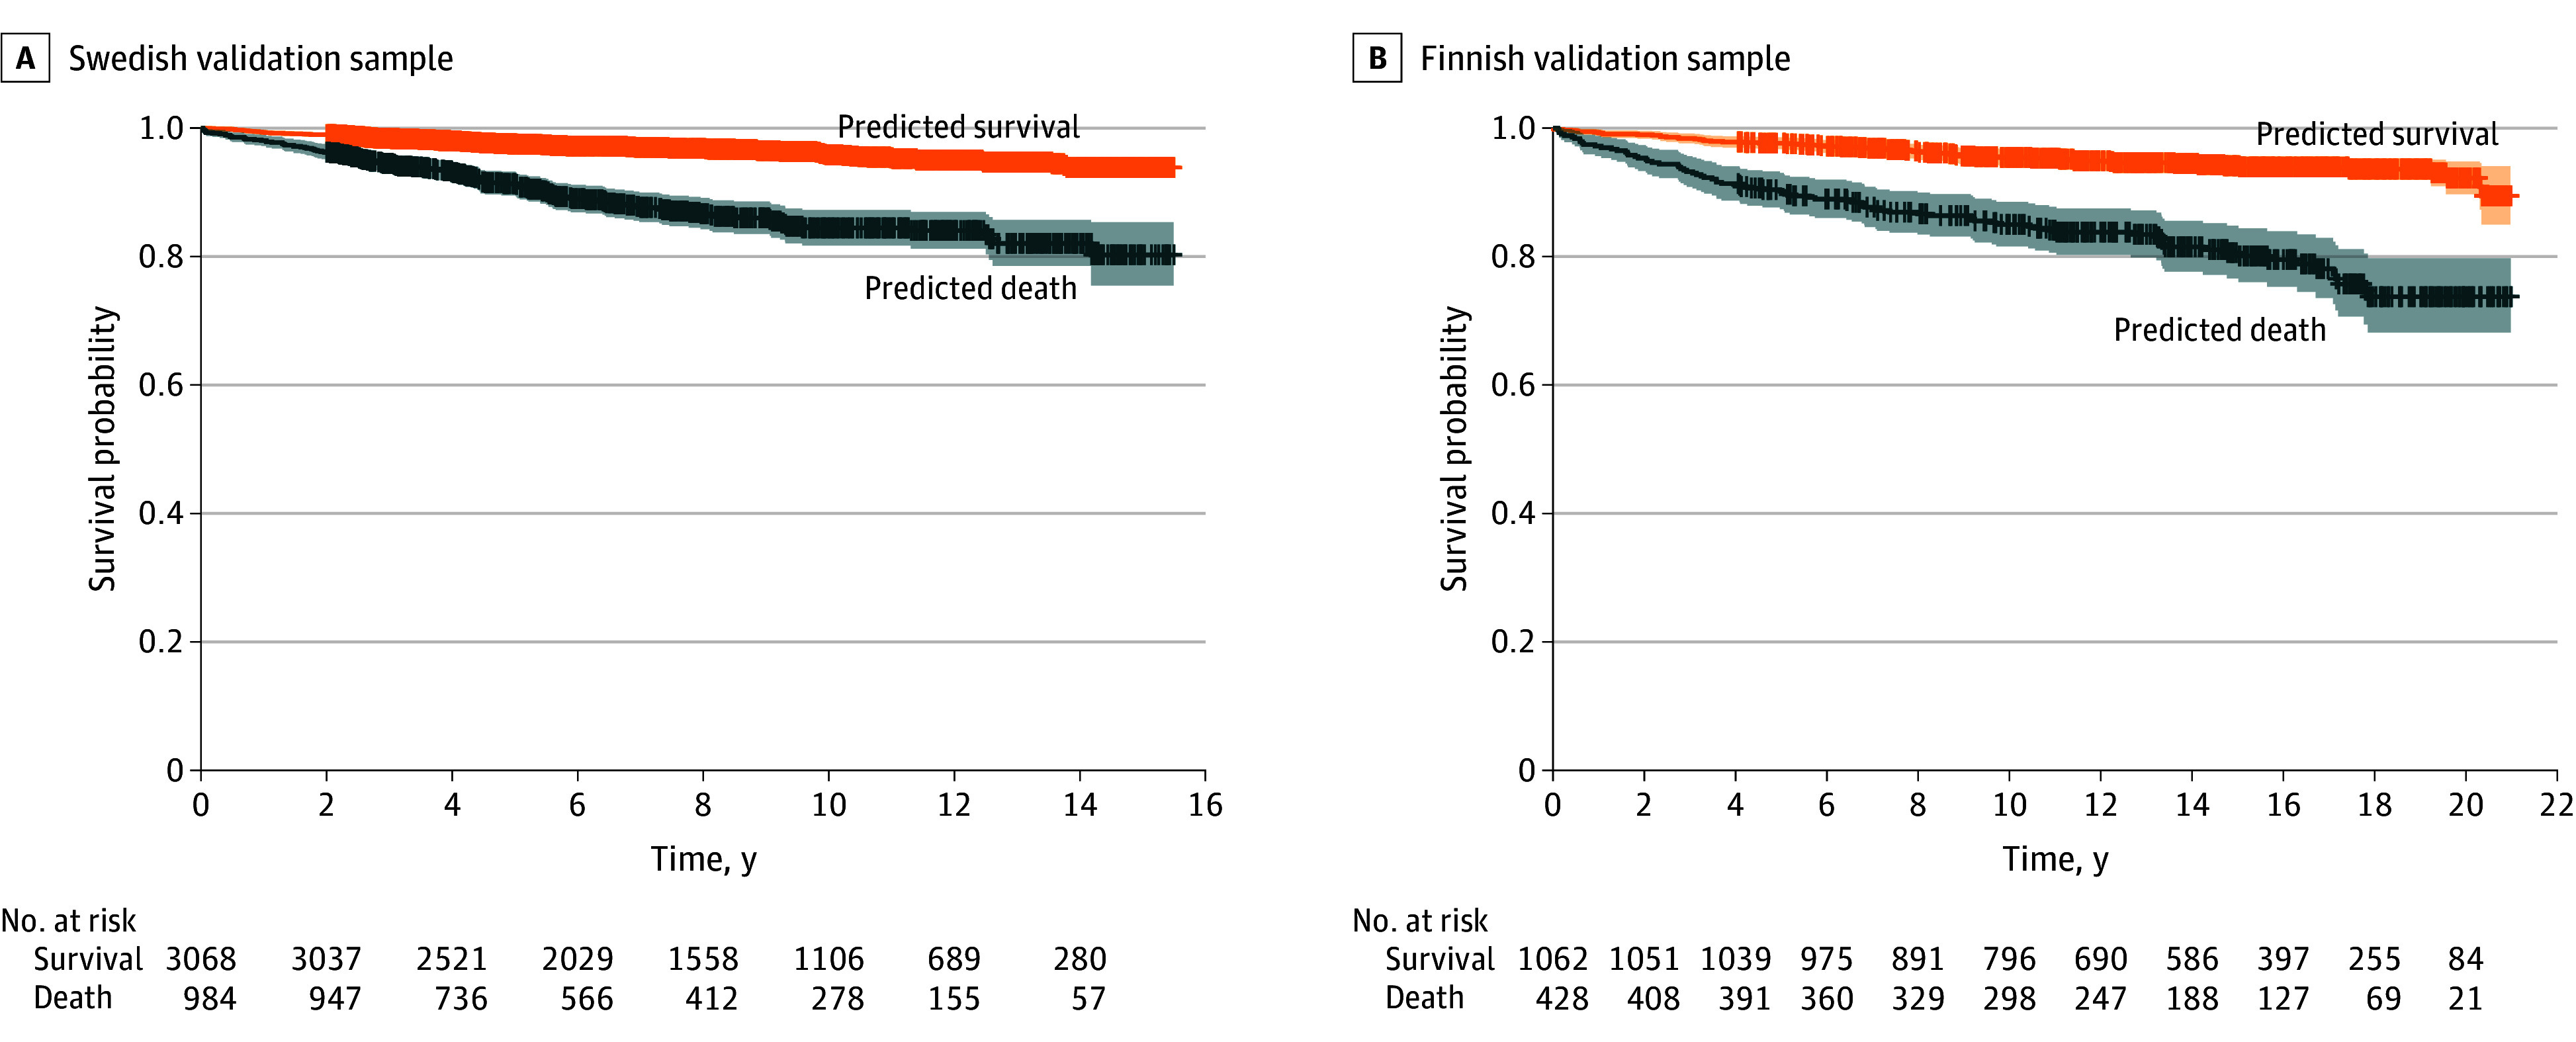
Figure 3. Survival Analyses.

Kaplan-Meier plots are shown for Swedish (A) and Finnish (B) validation samples with total follow-up (time in years) and censoring. Stratification was done using the final model with 5 variables trained in the discovery sample: substance use comorbidities, first hospitalization duration due to first-episode psychosis, male sex, prior somatic hospitalizations, and age. Shaded areas represent 95% CIs.
