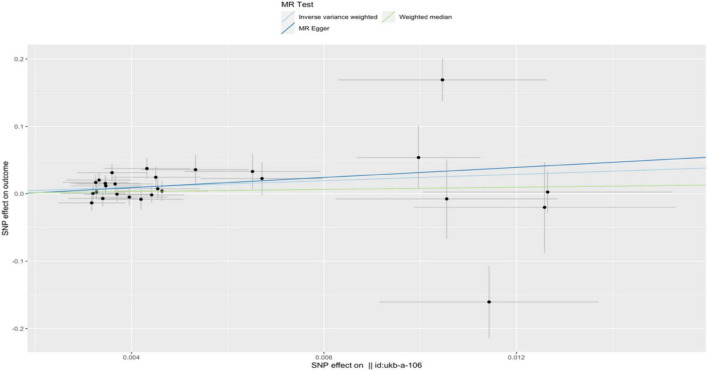
FIGURE 5.
A scatterplot used to analyze the genetic causal relationship between OA and COPD. In the scatterplot, the x-axis represents the effect of individual SNPs on OA, and the y-axis represents the effect of individual SNPs on COPD. The colored diagonal line represents the fitted line for the causal effect estimation of OA on COPD. From the graph, it can be observed that as the risk of OA increases, the risk of COPD incidence also rises.

