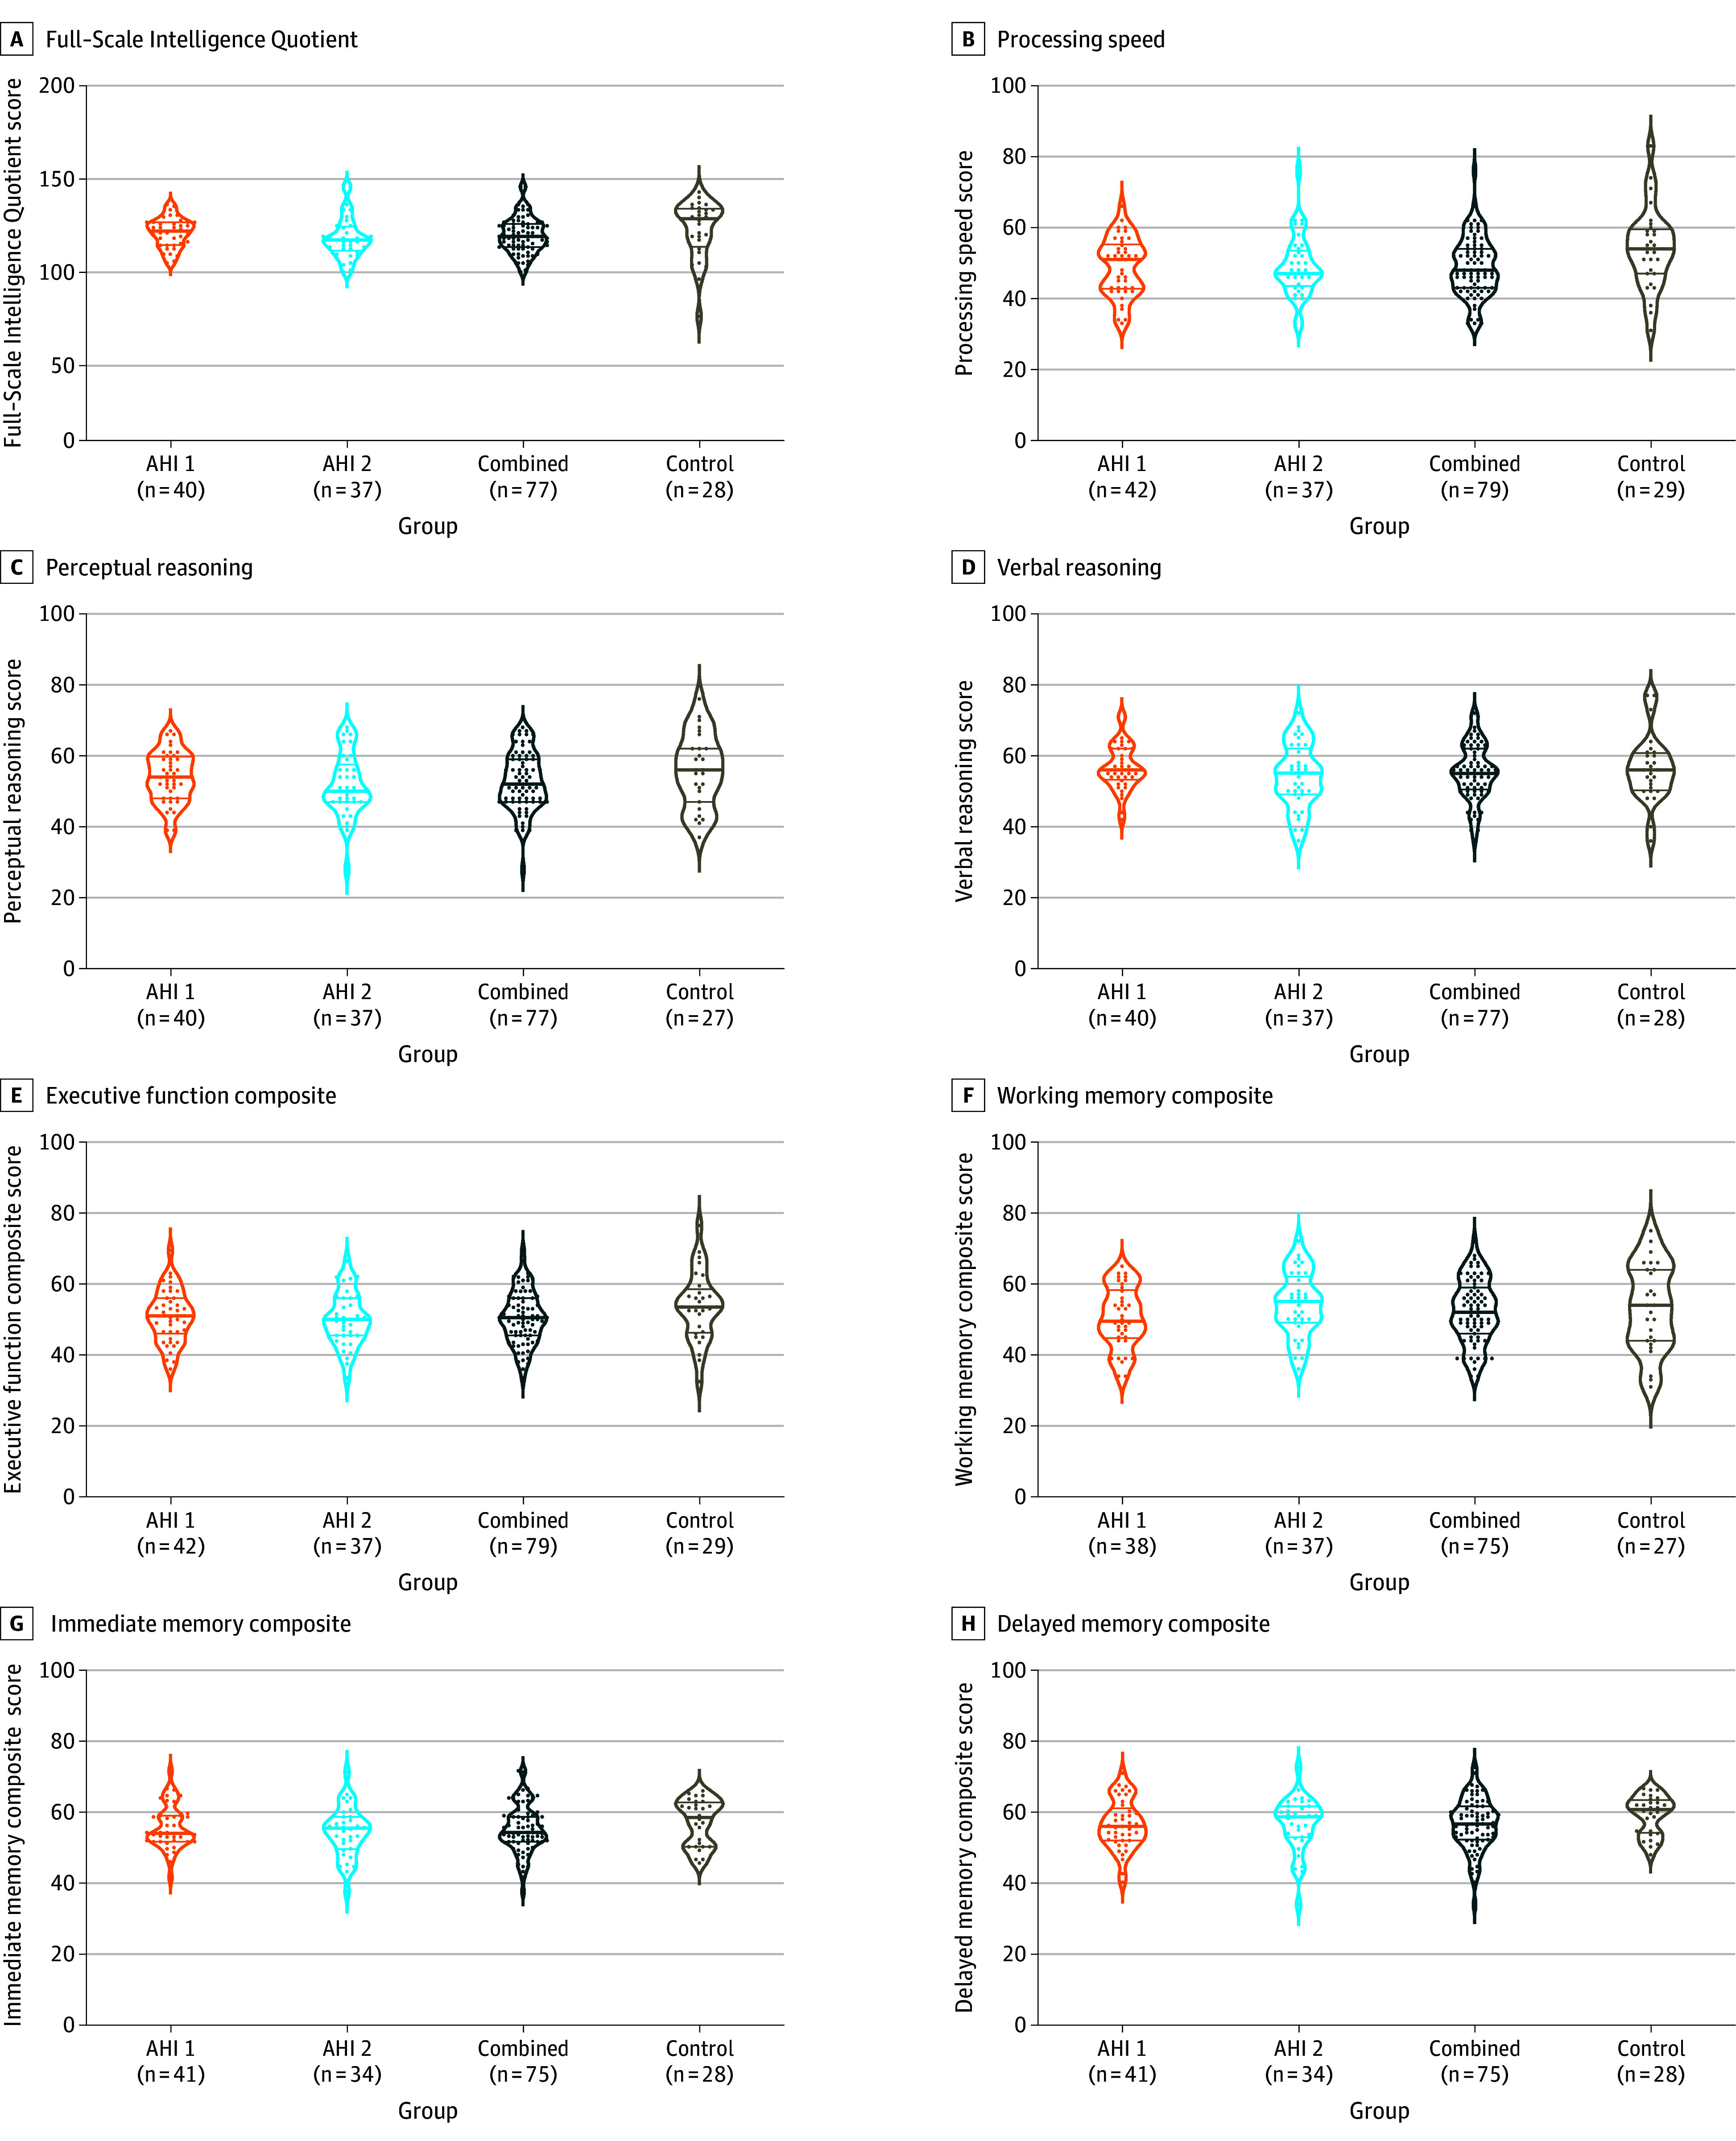
Figure 2. Cognitive Findings From the Full-Scale Intelligence Quotient.

All data shown were collected during the initial visit to the National Institutes of Health (median, 76 days [IQR, 30-537]) after the most recent anomalous health incident (AHI). The plots show density, with each dot representing an individual. The thicker, middle horizonal line in the plot indicates the median, while the other 2 lines represent the IQR. The P values are from a rank-based regression and corrected for multiple comparisons using the Šidák method (groupwise) and Tukey Honestly Significant Difference (pairwise). The Full-Scale Intelligence Quotient raw score and its subdomains (B, C, D, F, and G) are shown, as well as calculated composite scores (E, G, and H) (page 9 in Supplement 1). A lower score indicates worse performance. The AHI groups did not differ significantly from each other or compared with control participants (P > .05).
