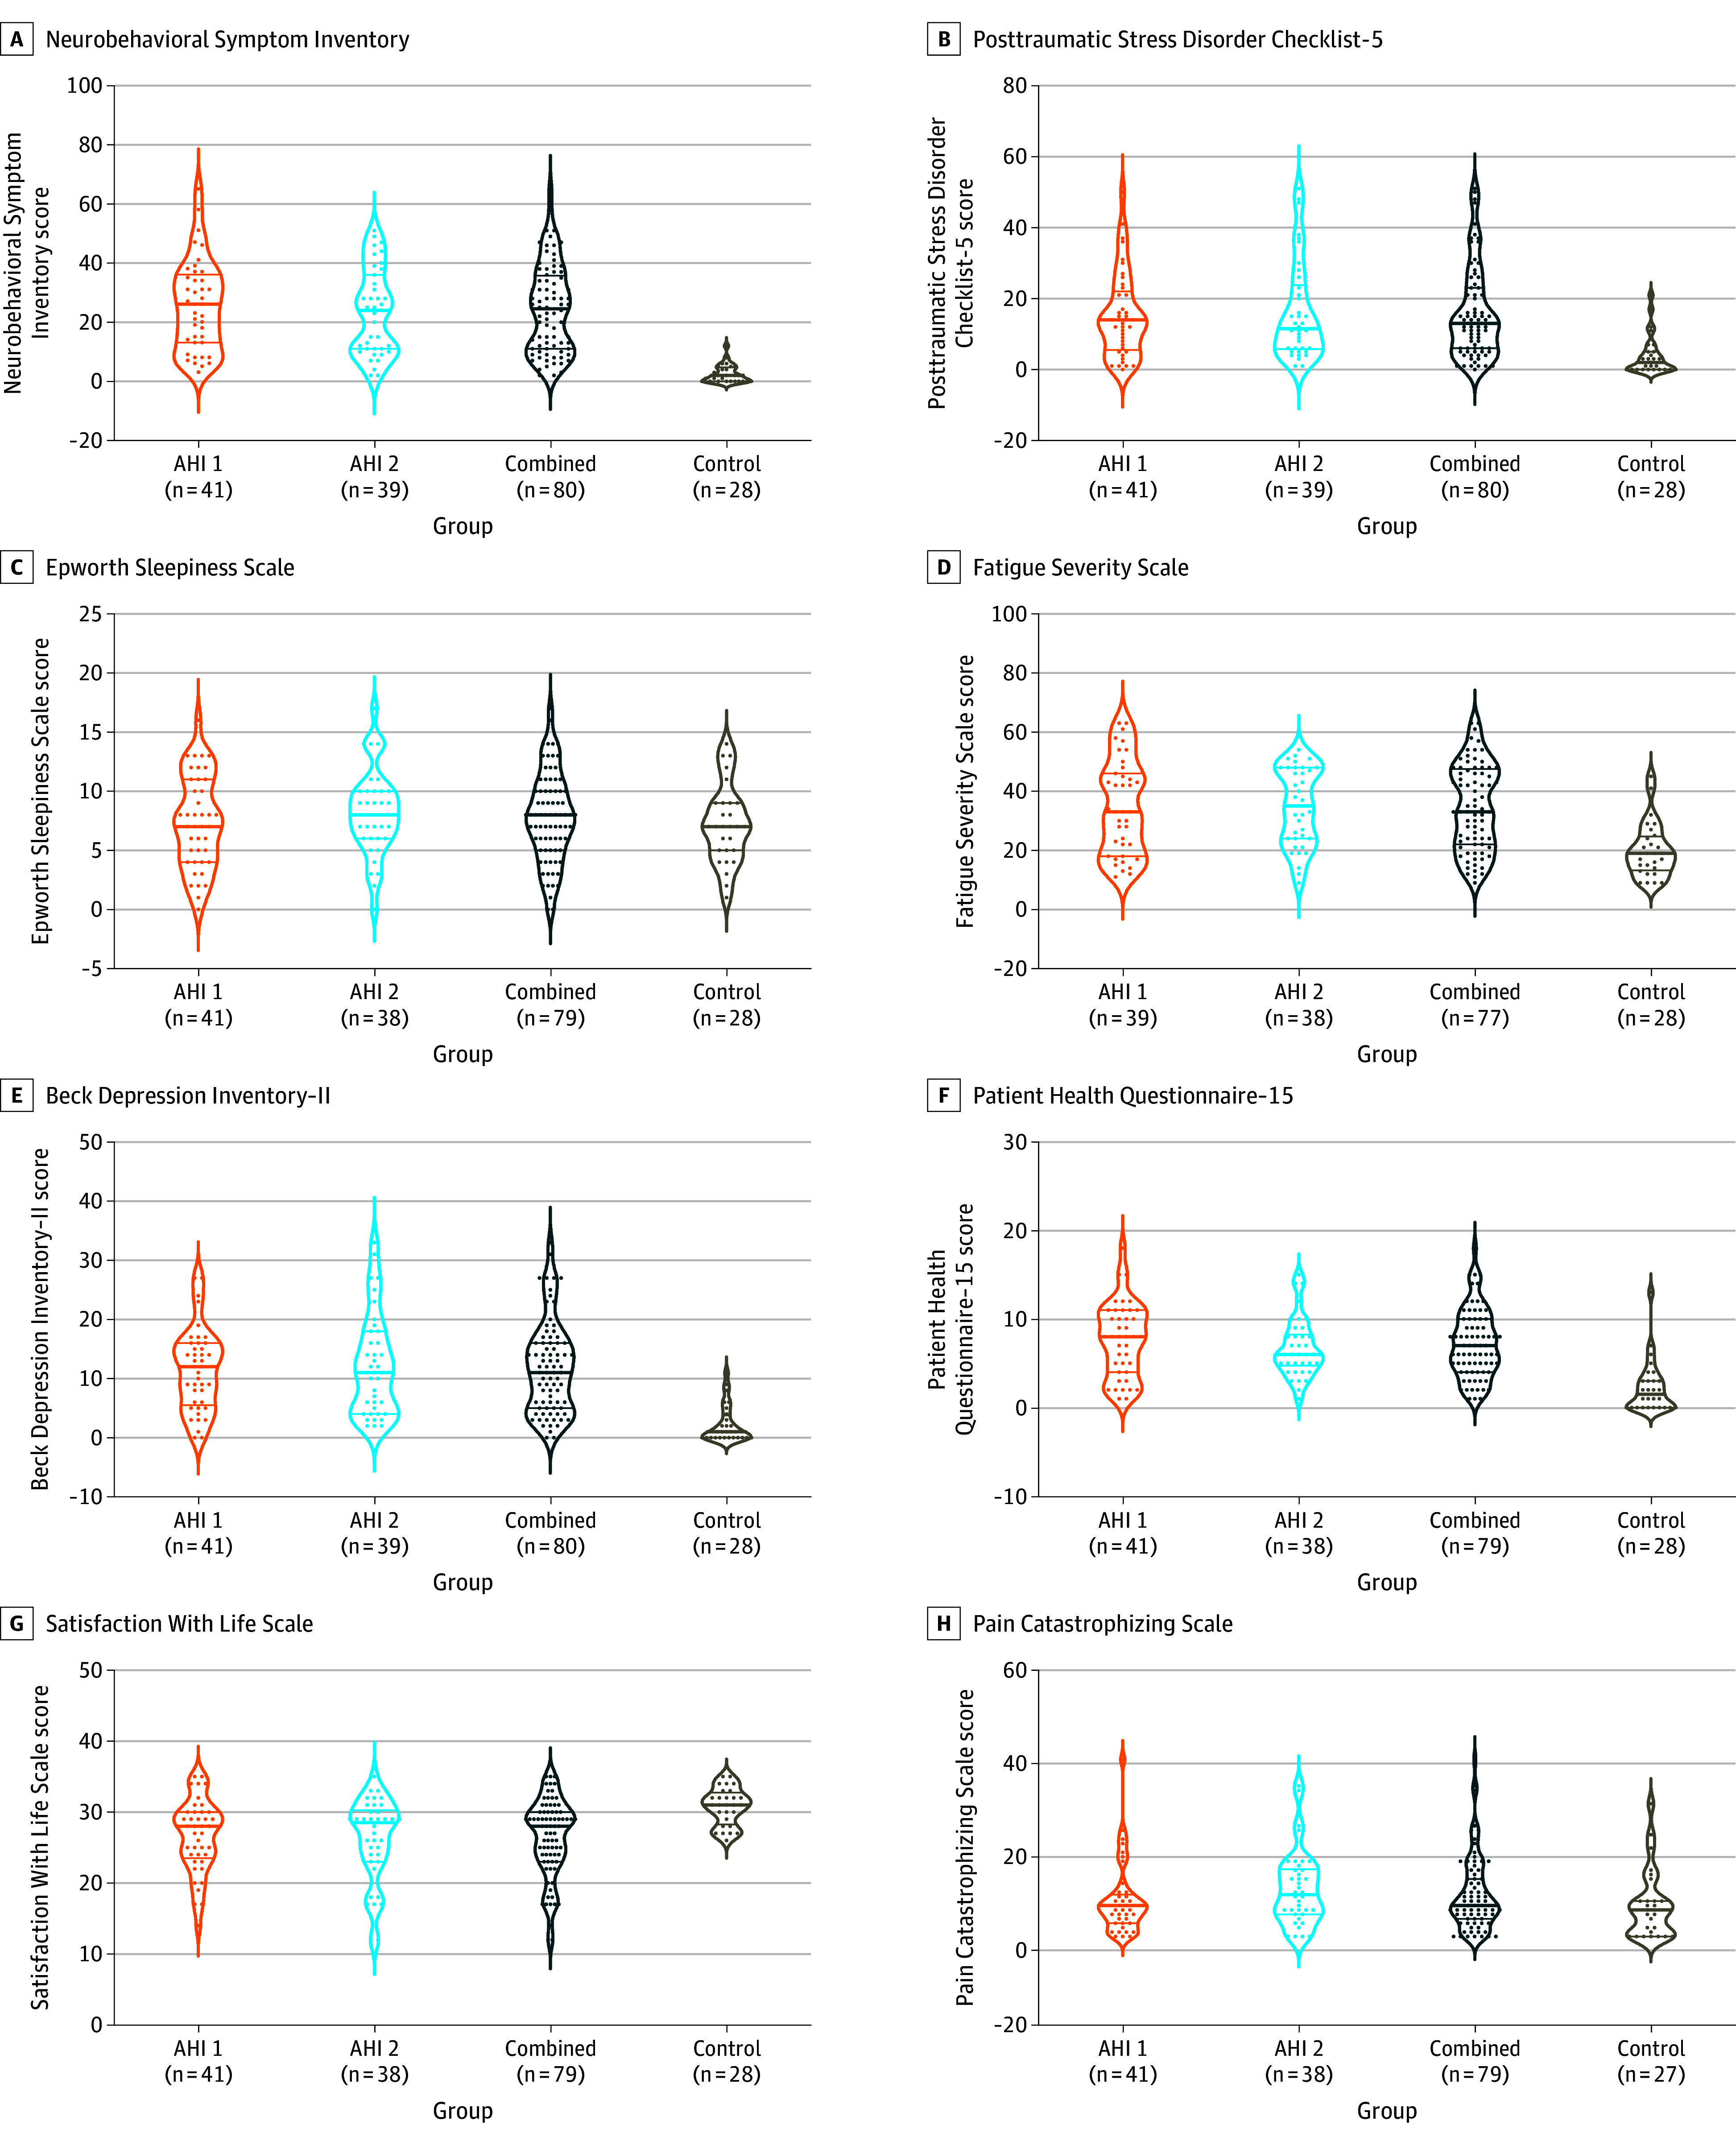
Figure 3. Self-Reports Based on Questionnaire.

All data shown were collected during the initial visit to the National Institutes of Health (median, 76 days [IQR, 30-537]) after the most recent anomalous health incident (AHI). See Figure 2 legend for details regarding interpretation of plots and P values. The self-reported (a paper-based questionnaire) measures in the AHI group compared with the vocationally matched US government control participants are shown. A higher score for all the self-report tests indicates worse performance except for Satisfaction With Life Scale, where a lower score means worse quality of life. For the combined vs control groups, P < .001; AHI 1 vs control groups, P < .001; and AHI 2 vs control groups, P < .01 for panels A, B, D, E, F, and G. There were no significant differences for any comparisons in panels C and H (P > .05).
