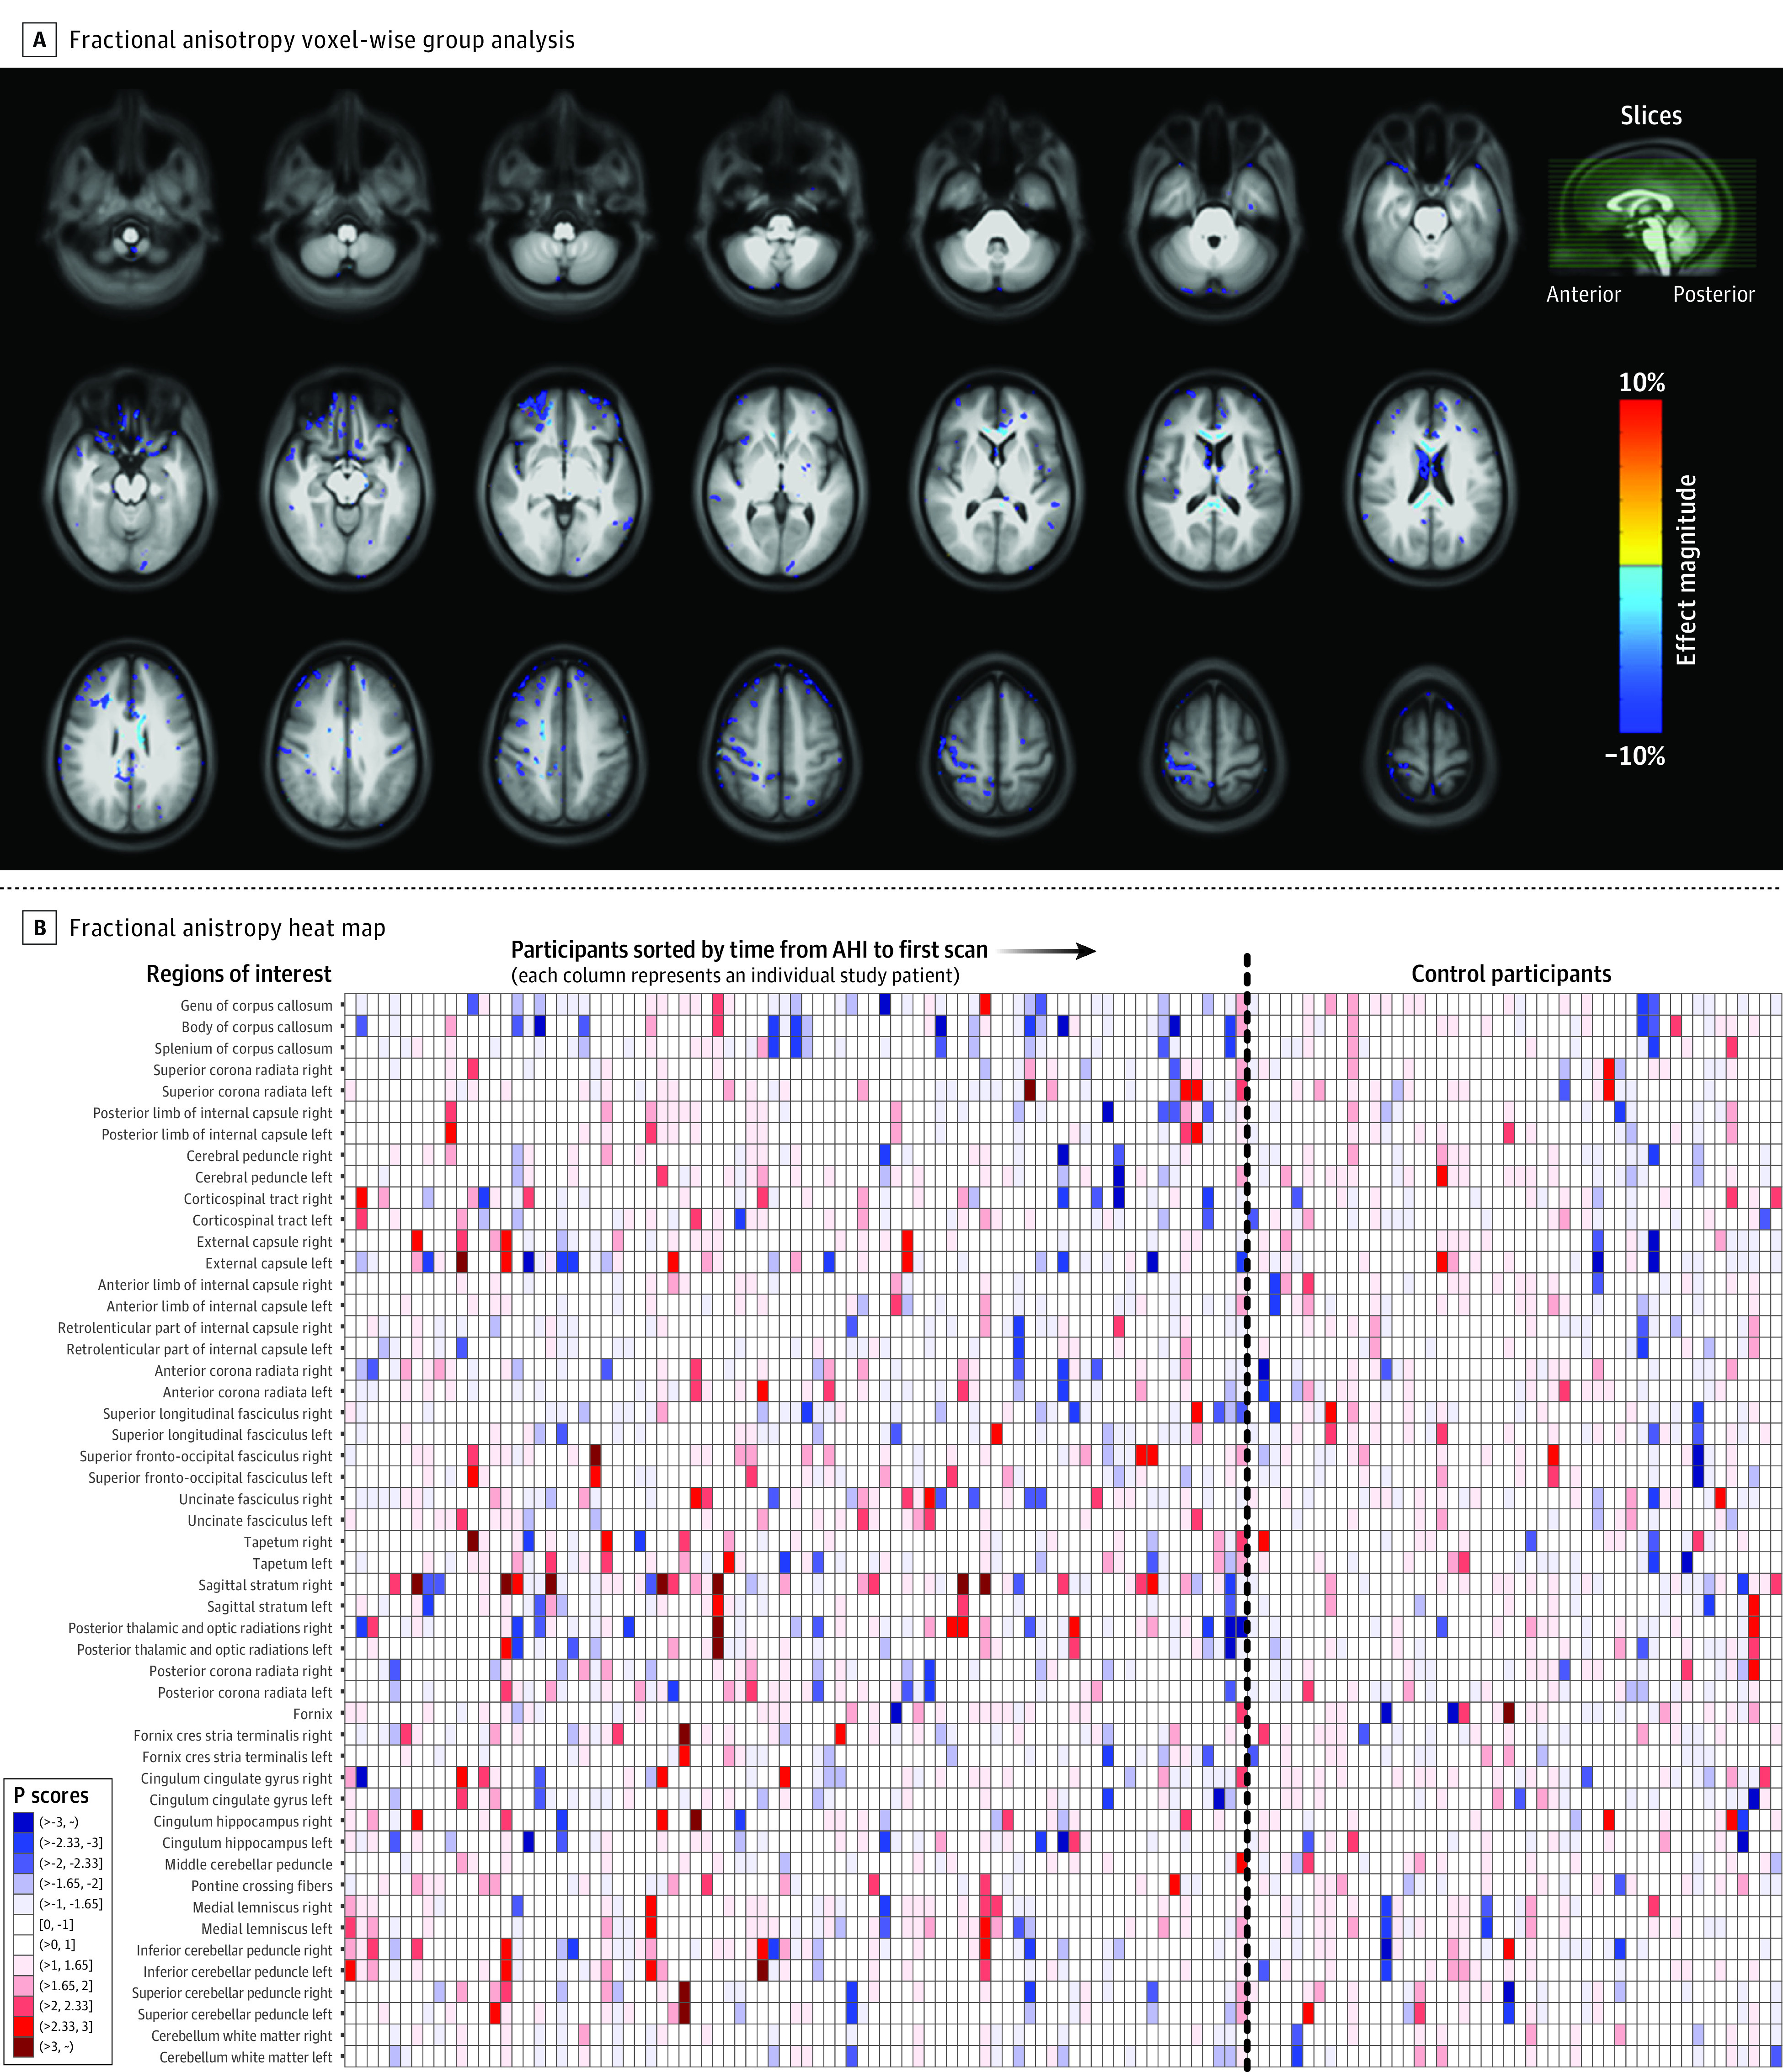
Figure 4. Voxel-Wise Map of Group Difference for the Fractional Anisotropy Measurements Between Participants With Anomalous Health Incidents and Control Participants and ROI-Wise Heat Map of Individuals.

A, Analysis similar to that shown in Figure 2A, but the map illustrates fractional anisotropy from diffusion magnetic resonance imaging (unadjusted P < .01, 2-sided). Some clusters can be seen in the corpus callosum with small magnitude of difference (≈2%), where the anomalous health incident (AHI) group showed lower anisotropy compared with the control group. B, Analysis similar to that shown in Figure 2B, but the heat map illustrates fractional anisotropy. Some individual striations of red and blue are also apparent with no systematic patterns across regions of interest (ROI). See Figure 2B legend for explanation of key.
