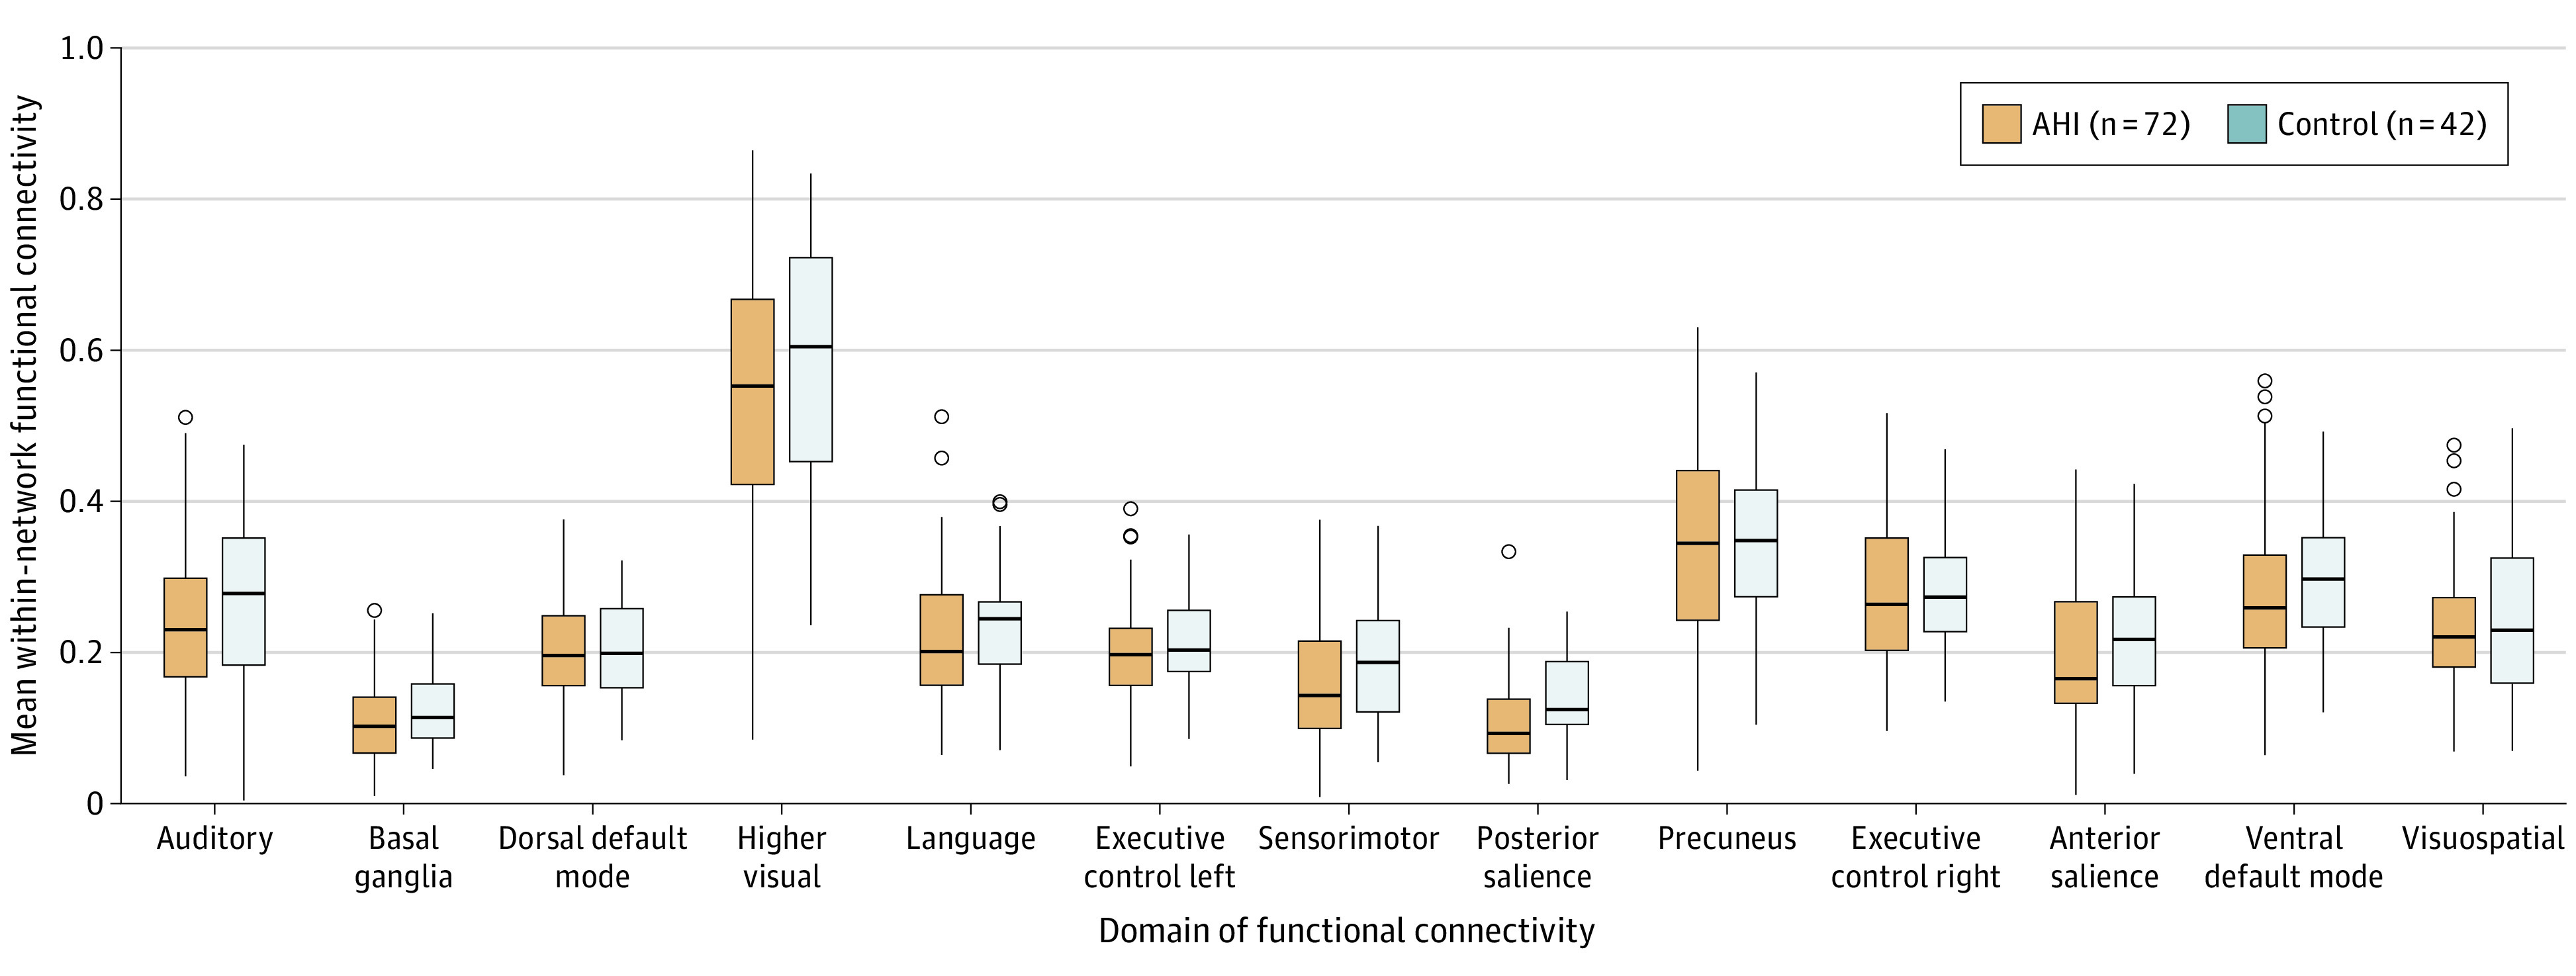
Figure 5. Within-Network Functional Connectivity Between Control Participants and Participants With AHIs.

Within-network functional connectivity values (y-axis) were estimated by taking the mean of all correlations between each unique pair of region of interest (ROI) combinations comprising the corresponding large-scale resting-state networks (x-axis). For example, the posterior salience network consists of n = 12 ROIs. This would have ½ × n(n – 1) = 66 unique ROI-paired connections from which the mean functional connectivity was estimated. Horizontal lines within boxes indicate the medians in each group. Boxes indicate interquartile range; horizontal lines within boxes, median. Whiskers indicate the spread of functional connectivity values within each group, up to 1.5 times the interquartile range. Dots indicate more extreme values. Some evidence of less functional connectivity within the posterior salience network can be observed within participants with anomalous health incidents (AHIs) compared with control participants (Mann-Whitney P = .006); however, the difference is not strong enough to survive adjustment for multiple comparisons (Benjamini-Hochberg P = .08).
