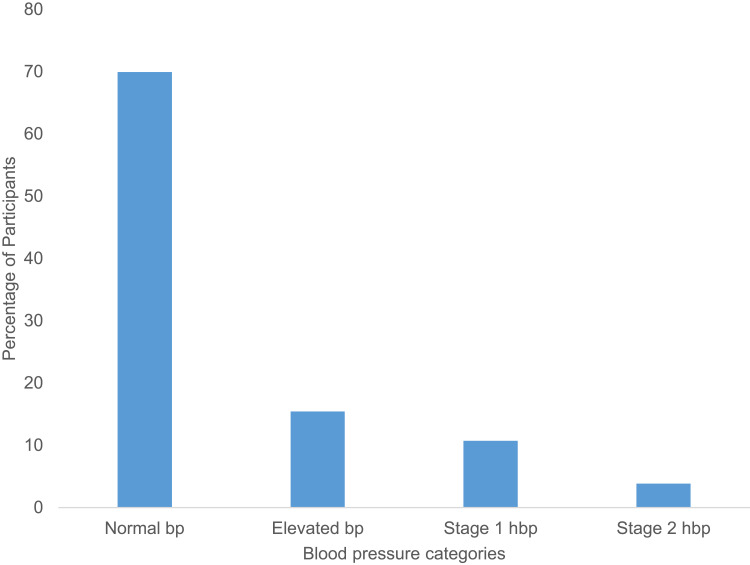
Figure 1.
A bar graph showing the variation in blood pressure of the study participants.
Notes: Proportion of the pregnant mothers in the study with the four categories of blood pressure (normal blood pressure, elevated blood pressure, stage 1 and stage 2 hypertension) expressed as a percentage of total number of participants. Key; bp, blood pressure and hbp, hypertension.

