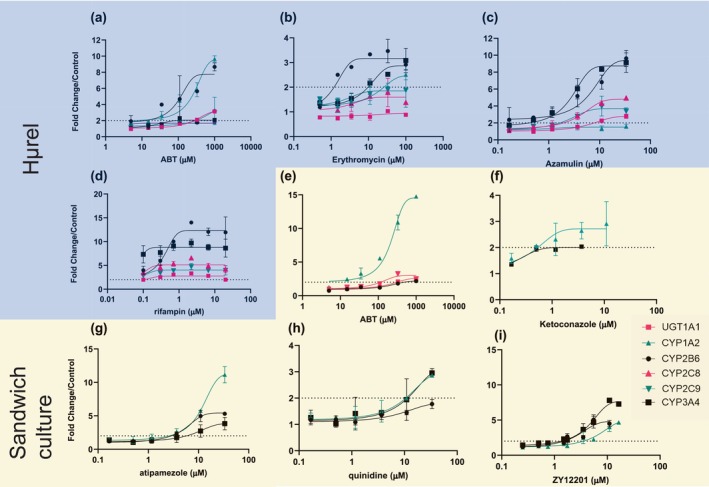
FIGURE 1.

Evaluation of mRNA level changes for UGT1A1 (pink squares), CYP1A2 (teal triangles), CYP2B6 (black circles), CYP2C8 (pink triangles), CYP2C9 (teal upside down triangles), or CYP3A4 (black squares), UGT1A6 (data not shown) following administration of ABT, erythromycin, azamulin, or rifampin (a, b, c, d, respectively) to Hμrel co‐culture model or ABT, ketoconazole, atipamezole, quinidine, or ZY12201 to sandwich cultured hepatocytes (e, f, g, h, i, respectively). Note studies conducted with Hμrel (blue background) looked at all mRNA end points, whereas studies conducted in sandwich cultured hepatocytes (yellow background) focused on sensitive markers of AhR, CAR, and PXR activation (CYP1A2, CYP2B6, and CYP3A4, respectively). Each data point is representative of two with error, dashed line represents twofold change from vehicle control. Induction potential for ABT and other commonly used inhibitors in the Hμrel co‐culture model (a, b, c, d) or sandwich cultured human hepatocytes (e, f, g, i) Dashed line represents twofold increase in mRNA levels.
