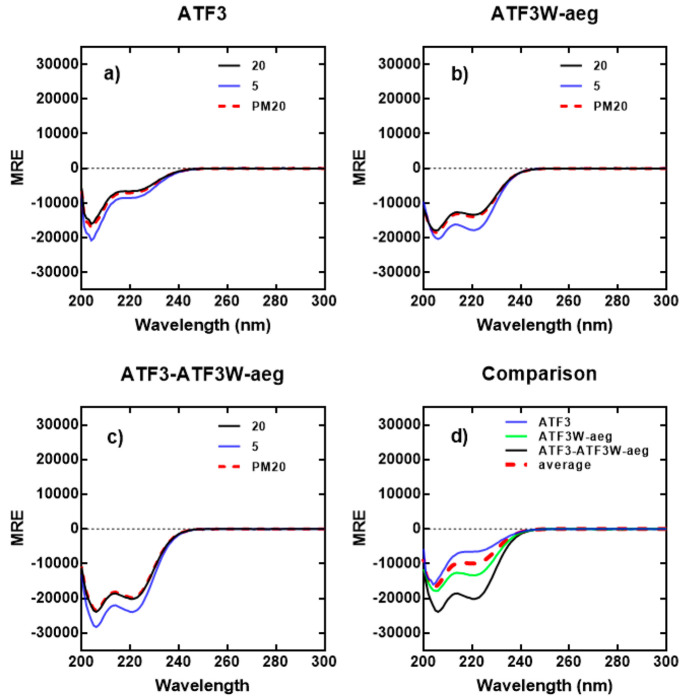
Figure 6.
CD spectra data indicates a ATF3-ATF3W_aeg interaction. CD spectra are shown for (a) ATF3, (b) ATF3W_aeg, and (c) ATF3-ATF3W_aeg, with all samples premixed at 1:1 stoichiometry. Spectra were next measured at 20 and 5 °C and again post-thermal denaturation (PM 20 °C to establish reversible that unfolding is fully reversible) at a total peptide concentration of 150 μM and presented as mean residue ellipticity (MRE). (d) CD spectra are shown at 20 °C for ATF3 and ATF3W_aeg alone and mixed, the latter demonstrating a significant gain in measured signal (black) over the average of the two component signals (red hash). All spectra are indicative of helical structures. All experiments were performed in 10 mM potassium phosphate and 100 mM potassium fluoride (pH 7.0). CD spectra for interactions with component ATF3W_a and ATF3W_eg peptides are shown in the Supporting Information.

