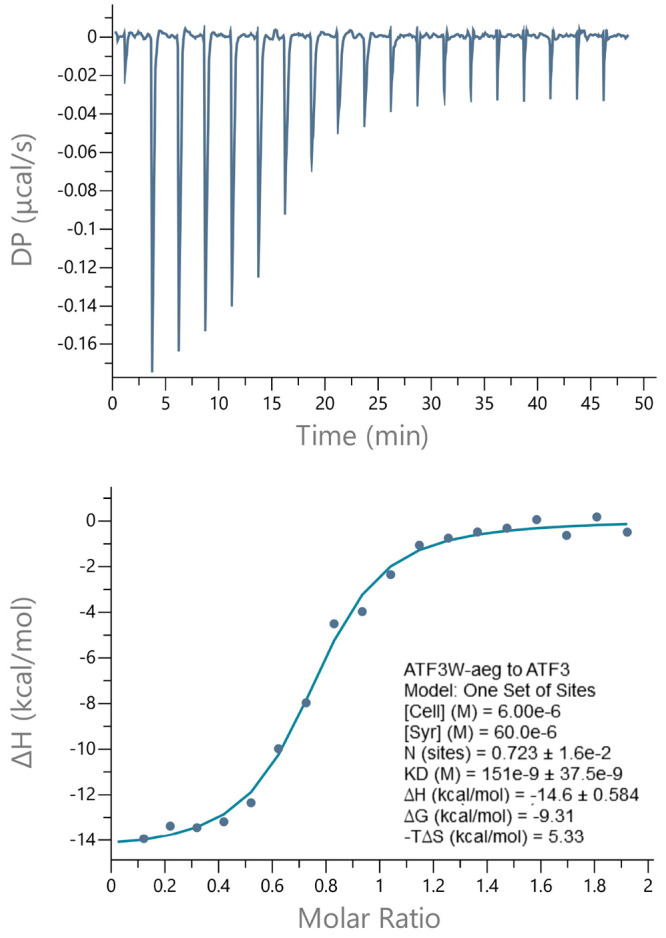
Figure 9.

Isothermal titration calorimetry analysis of the ATF3-ATF3W_aeg interaction. In the bottom plot, the solid line represents the fit to the data based on the binding of a ligand to a macromolecule using the MicroCal (GE Healthcare) Origin software.16 See Materials and Methods for further details.
